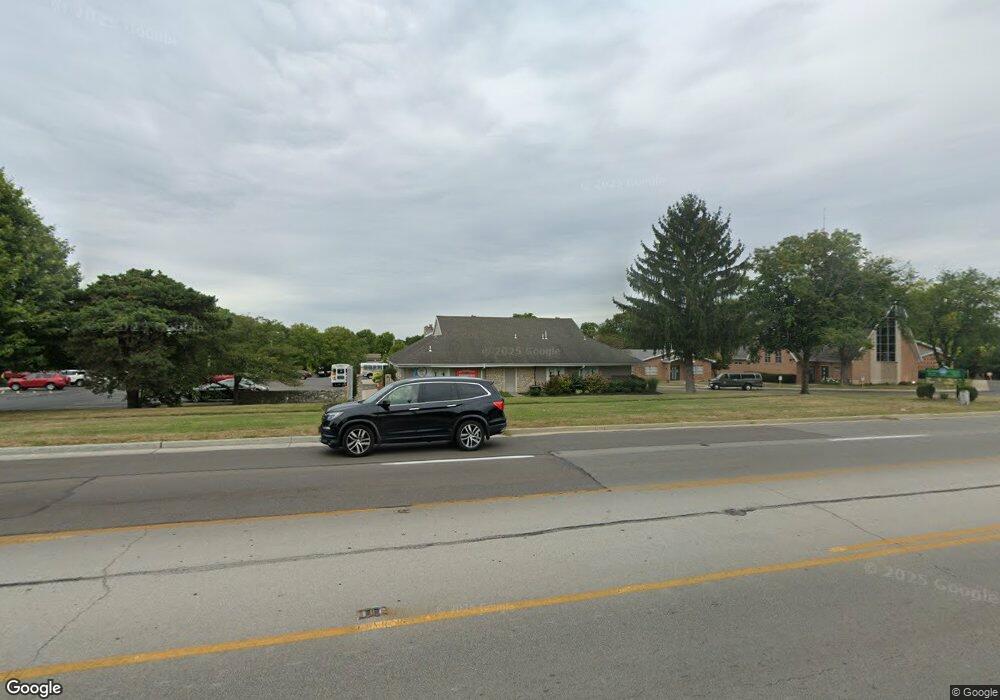
6550 N Main St Dayton, OH 45415
Estimated Value: $584,800
--
Bed
--
Bath
6,341
Sq Ft
$92/Sq Ft
Est. Value
About This Home
This home is located at 6550 N Main St, Dayton, OH 45415 and is currently estimated at $584,800, approximately $92 per square foot. 6550 N Main St is a home located in Montgomery County with nearby schools including Valerie Elementary School, Imagine Schools - Woodbury Academy, and Horizon Science Academy-Dayton Elementary School.
Ownership History
Date
Name
Owned For
Owner Type
Purchase Details
Closed on
Jan 18, 2018
Sold by
North Face Investments Llc
Bought by
Move Forward Holdings Llc
Current Estimated Value
Home Financials for this Owner
Home Financials are based on the most recent Mortgage that was taken out on this home.
Original Mortgage
$216,750
Outstanding Balance
$182,911
Interest Rate
3.94%
Mortgage Type
Construction
Estimated Equity
$401,889
Purchase Details
Closed on
Jan 21, 2000
Sold by
The Genovesi Family Partnership
Bought by
North Face Investments Llc
Home Financials for this Owner
Home Financials are based on the most recent Mortgage that was taken out on this home.
Original Mortgage
$39,500
Interest Rate
7.98%
Mortgage Type
Commercial
Create a Home Valuation Report for This Property
The Home Valuation Report is an in-depth analysis detailing your home's value as well as a comparison with similar homes in the area
Home Values in the Area
Average Home Value in this Area
Purchase History
| Date | Buyer | Sale Price | Title Company |
|---|---|---|---|
| Move Forward Holdings Llc | $275,000 | None Available | |
| North Face Investments Llc | $395,000 | -- | |
| Genovesi Family Partnership Ltd | -- | -- |
Source: Public Records
Mortgage History
| Date | Status | Borrower | Loan Amount |
|---|---|---|---|
| Open | Move Forward Holdings Llc | $216,750 | |
| Previous Owner | Genovesi Family Partnership Ltd | $39,500 | |
| Previous Owner | Genovesi Family Partnership Ltd | $316,000 |
Source: Public Records
Tax History Compared to Growth
Tax History
| Year | Tax Paid | Tax Assessment Tax Assessment Total Assessment is a certain percentage of the fair market value that is determined by local assessors to be the total taxable value of land and additions on the property. | Land | Improvement |
|---|---|---|---|---|
| 2024 | $13,061 | $102,970 | $21,000 | $81,970 |
| 2023 | $13,061 | $102,970 | $21,000 | $81,970 |
| 2022 | $13,036 | $93,420 | $19,090 | $74,330 |
| 2021 | $13,215 | $93,420 | $19,090 | $74,330 |
| 2020 | $13,306 | $93,610 | $19,090 | $74,520 |
| 2019 | $13,957 | $96,250 | $19,090 | $77,160 |
| 2018 | $9,443 | $64,340 | $19,090 | $45,250 |
| 2017 | $9,433 | $64,340 | $19,090 | $45,250 |
| 2016 | $10,134 | $67,730 | $19,090 | $48,640 |
| 2015 | $9,124 | $67,730 | $19,090 | $48,640 |
| 2014 | $9,124 | $67,730 | $19,090 | $48,640 |
| 2012 | -- | $61,310 | $18,930 | $42,380 |
Source: Public Records
Map
Nearby Homes
- 159 Burgess Ave
- 5653 Philadelphia Dr
- 71 Westbrook Rd
- 4763 Shaunee Creek Dr Unit 31
- 7725 Harrington Ave
- 4743 Shaunee Creek Dr Unit 21
- 4553 Lansmore Dr Unit 37
- 0 Tall Hickory Trail
- 270 Pamela Ave
- 4507 Lansmore Dr Unit 83
- 7815 N Main St Unit 14
- 0 Springway Dr Unit 927025
- 701 Fredericksburg Dr
- 7935 Harrington Ave
- 5025 Basore Rd
- 4130 Fleetwood Dr
- 6552 Stillcrest Way
- 266 Briarcliff Rd
- 4431 Wolf Rd
- 455 Shiloh Dr
- 6540 N Main St
- 100 E Woodbury Dr
- 5430 Cornwall Dr
- 5442 Cornwall Dr
- 15 Burgess Ave
- 21 Burgess Ave
- 25 Burgess Ave
- 5416 Cornwall Dr
- 15 Burgess Ave
- 6557 N Main St
- 29 Burgess Ave
- 33 Burgess Ave
- 5400 Cornwall Dr
- 6537 N Main St
- 35 Burgess Ave
- 5384 Cornwall Dr
- 77 E Woodbury Dr
- 5423 Cornwall Dr
- 5368 Cornwall Dr
- 18 Burgess Ave