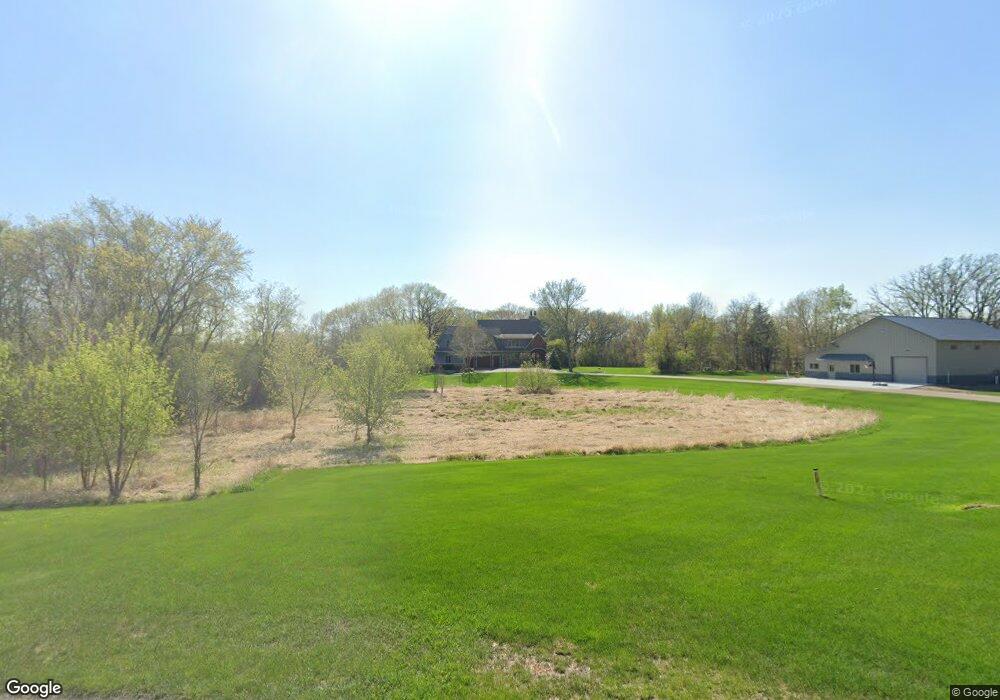
6550 Olstad Dr Maple Plain, MN 55359
Estimated Value: $1,952,000 - $2,389,000
5
Beds
5
Baths
4,694
Sq Ft
$466/Sq Ft
Est. Value
About This Home
This home is located at 6550 Olstad Dr, Maple Plain, MN 55359 and is currently estimated at $2,185,482, approximately $465 per square foot. 6550 Olstad Dr is a home located in Hennepin County with nearby schools including Schumann Elementary School, Orono Intermediate Elementary School, and Orono Middle School.
Ownership History
Date
Name
Owned For
Owner Type
Purchase Details
Closed on
Nov 15, 2018
Sold by
Dean Gary L and Dean Paula A
Bought by
Dean Gary L and Dean Paula A
Current Estimated Value
Purchase Details
Closed on
Jun 15, 2018
Sold by
Picon Juan E and Picon Andra
Bought by
Dean Gary L and Dean Paula A
Home Financials for this Owner
Home Financials are based on the most recent Mortgage that was taken out on this home.
Original Mortgage
$1,128,000
Interest Rate
3.62%
Mortgage Type
Adjustable Rate Mortgage/ARM
Purchase Details
Closed on
Jun 10, 2016
Sold by
Chargo Mitchel C and Chargo Susan L
Bought by
Picon Juan E and Picon Andrea Banes
Home Financials for this Owner
Home Financials are based on the most recent Mortgage that was taken out on this home.
Original Mortgage
$1,060,000
Interest Rate
3.66%
Mortgage Type
New Conventional
Purchase Details
Closed on
Aug 7, 2009
Sold by
Estate Development Corporation
Bought by
Chargo Susan L
Create a Home Valuation Report for This Property
The Home Valuation Report is an in-depth analysis detailing your home's value as well as a comparison with similar homes in the area
Home Values in the Area
Average Home Value in this Area
Purchase History
| Date | Buyer | Sale Price | Title Company |
|---|---|---|---|
| Dean Gary L | -- | None Available | |
| Dean Gary L | $1,410,000 | Watermark Title Agency | |
| Picon Juan E | $1,325,000 | Stewart Title | |
| Chargo Susan L | $250,000 | -- |
Source: Public Records
Mortgage History
| Date | Status | Borrower | Loan Amount |
|---|---|---|---|
| Previous Owner | Dean Gary L | $1,128,000 | |
| Previous Owner | Picon Juan E | $1,060,000 |
Source: Public Records
Tax History
| Year | Tax Paid | Tax Assessment Tax Assessment Total Assessment is a certain percentage of the fair market value that is determined by local assessors to be the total taxable value of land and additions on the property. | Land | Improvement |
|---|---|---|---|---|
| 2024 | $26,100 | $2,012,200 | $345,000 | $1,667,200 |
| 2023 | $23,433 | $1,864,800 | $327,800 | $1,537,000 |
| 2022 | $20,091 | $1,664,000 | $268,000 | $1,396,000 |
| 2021 | $19,792 | $1,386,000 | $253,000 | $1,133,000 |
| 2020 | $20,785 | $1,358,000 | $242,000 | $1,116,000 |
| 2019 | $19,695 | $1,377,000 | $237,000 | $1,140,000 |
| 2018 | $19,575 | $1,289,000 | $237,000 | $1,052,000 |
| 2017 | $14,585 | $959,000 | $171,000 | $788,000 |
| 2016 | $13,137 | $877,000 | $165,000 | $712,000 |
| 2015 | $12,822 | $850,000 | $138,000 | $712,000 |
| 2014 | -- | $807,000 | $149,000 | $658,000 |
Source: Public Records
Map
Nearby Homes
- 6695 Mckown Ct
- 3050 Becker Rd
- 3375 County Road 90
- 3035 Lake Sarah Rd
- 3490 William Way
- 3512 William Way
- 3602 William Way
- 3651 William Way
- 3695 William Way
- 5946 Kochs Crossing
- 1487 Meadow Ln
- 5112 S Lakeshore Dr
- 6126 Gustavus Dr
- 4972 Bridgevine Way
- 1635 Delano Ave
- 5340 Main St E
- 4894 Bridgevine Way
- 4946 Bridgevine Way
- 5508 Joyce St
- 1351 County Road 83
- 6550 Olstad Dr
- LT 3 BL 1 Olstad Dr
- 6505 Olstad Dr
- 6500 Olstad Dr
- 6515 Meadow Ridge
- 6515 Meadow Ridge
- 6455 Meadow Ridge
- 6455 Meadow Ridge
- 6525 6525 Meadow-Ridge-
- 2825 County Road 90
- 6525 Meadow Ridge
- 6465 Olstad Dr
- 6595 Franklin Hills Rd
- 2695 County Road 90
- 2695 County Road 90
- 3025 County Road 90
- 2750 County Road 90
- 2995 County Road 90
- 2995 County Road 90
- 6575 Franklin Hills Rd
Your Personal Tour Guide
Ask me questions while you tour the home.