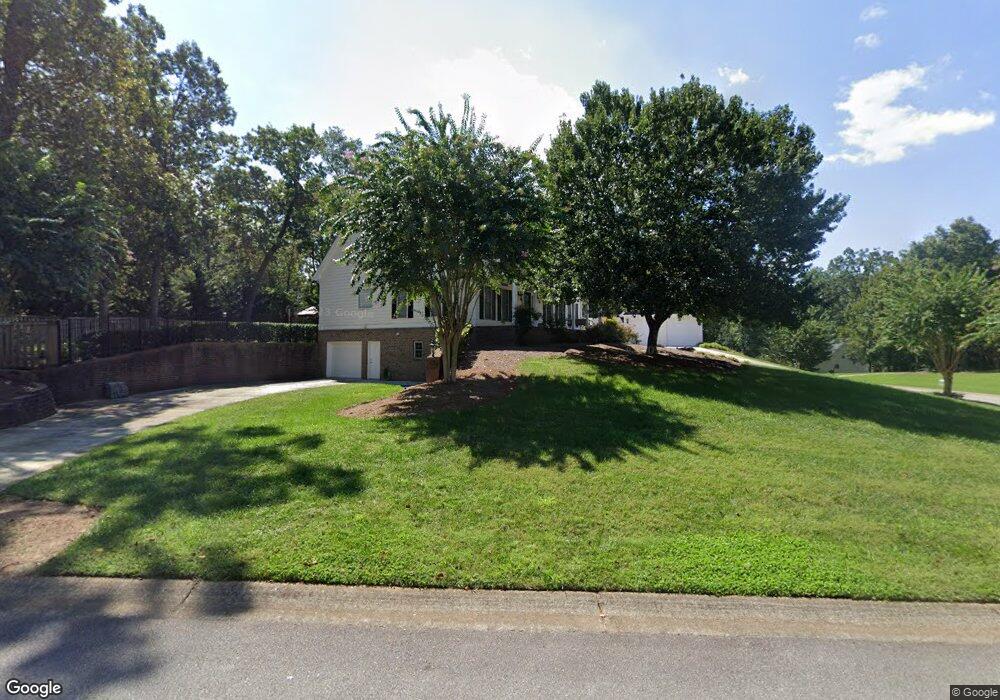
6551 Pond View Ct Unit 2 Clermont, GA 30527
Estimated Value: $584,283 - $602,000
3
Beds
4
Baths
4,692
Sq Ft
$127/Sq Ft
Est. Value
About This Home
This home is located at 6551 Pond View Ct Unit 2, Clermont, GA 30527 and is currently estimated at $593,571, approximately $126 per square foot. 6551 Pond View Ct Unit 2 is a home located in Hall County with nearby schools including Wauka Mountain Elementary School, North Hall Middle School, and North Hall High School.
Ownership History
Date
Name
Owned For
Owner Type
Purchase Details
Closed on
Nov 5, 2020
Sold by
Mirry David
Bought by
Bernstein Steve and Bernstein Marsha G
Current Estimated Value
Home Financials for this Owner
Home Financials are based on the most recent Mortgage that was taken out on this home.
Original Mortgage
$368,220
Outstanding Balance
$325,593
Interest Rate
2.8%
Mortgage Type
New Conventional
Estimated Equity
$267,978
Purchase Details
Closed on
Sep 30, 2016
Sold by
Mabe Spencer and Mabe Betty
Bought by
Murry David B and Belknap Martina
Home Financials for this Owner
Home Financials are based on the most recent Mortgage that was taken out on this home.
Original Mortgage
$262,400
Interest Rate
3.46%
Purchase Details
Closed on
Jul 26, 2001
Sold by
Merritt William David
Bought by
Mabe Spencer and Mabe Betty
Create a Home Valuation Report for This Property
The Home Valuation Report is an in-depth analysis detailing your home's value as well as a comparison with similar homes in the area
Home Values in the Area
Average Home Value in this Area
Purchase History
| Date | Buyer | Sale Price | Title Company |
|---|---|---|---|
| Bernstein Steve | $387,600 | -- | |
| Murry David B | $328,000 | -- | |
| Mabe Spencer | $32,000 | -- |
Source: Public Records
Mortgage History
| Date | Status | Borrower | Loan Amount |
|---|---|---|---|
| Open | Bernstein Steve | $368,220 | |
| Previous Owner | Murry David B | $262,400 |
Source: Public Records
Tax History Compared to Growth
Tax History
| Year | Tax Paid | Tax Assessment Tax Assessment Total Assessment is a certain percentage of the fair market value that is determined by local assessors to be the total taxable value of land and additions on the property. | Land | Improvement |
|---|---|---|---|---|
| 2024 | $4,847 | $192,680 | $31,520 | $161,160 |
| 2023 | $3,976 | $208,200 | $35,880 | $172,320 |
| 2022 | $4,547 | $173,440 | $23,880 | $149,560 |
| 2021 | $4,064 | $151,880 | $21,760 | $130,120 |
| 2020 | $3,980 | $144,560 | $21,760 | $122,800 |
| 2019 | $4,228 | $152,480 | $7,960 | $144,520 |
| 2018 | $4,098 | $142,960 | $7,960 | $135,000 |
| 2017 | $3,727 | $131,160 | $7,960 | $123,200 |
| 2016 | $3,457 | $122,440 | $7,960 | $114,480 |
| 2015 | $2,861 | $99,721 | $7,960 | $91,761 |
| 2014 | $2,861 | $99,721 | $7,960 | $91,761 |
Source: Public Records
Map
Nearby Homes
- 6655 Windvane Point
- 6552 Shoal Creek Rd
- 6745 Little Whistle Way
- 6622 Old Cleveland Rd
- 6580 Cleveland Hwy
- 239 Brown Dr
- 455 Long Mountain Ct
- 0 Holly Springs Rd Unit 7661867
- 0 Holly Springs Rd Unit 25494296
- 0 Holly Springs Rd Unit 10623983
- 6217 Green Mountain Ln
- 6752 Shoal Creek Rd
- 6310 Green Mountain Ln
- 6708 Clermont Hwy
- 6632 Mountain Meadow Dr
- 000 Shadow Mountain Ln
- 6223 Hulsey Rd
- 8465 Georgia 254
- 6551 Pond View Ct
- 6555 Pond View Ct
- 6555 Pond View Ct Unit 3
- 6502 Wauka View Dr
- 6497 Wauka View Dr
- 6561 Pond View Ct
- 6511 Wauka View Dr
- 6560 Pond View Ct
- 6565 Pond View Ct
- 6496 Wauka View Dr
- 6514 Wauka View Dr
- 6564 Pond View Ct
- 6519 Wauka View Dr
- 6492 Wauka View Dr
- 6518 Wauka View Dr
- 6488 Wauka View Dr
- 6575 Pond View Ct
- 6584 Pond View Ct
- 6523 Wauka View Dr
- 6522 Wauka View Dr