Estimated payment $1,717/month
Highlights
- RV or Boat Parking
- Private Lot
- Partially Wooded Lot
- Odum Elementary School Rated 9+
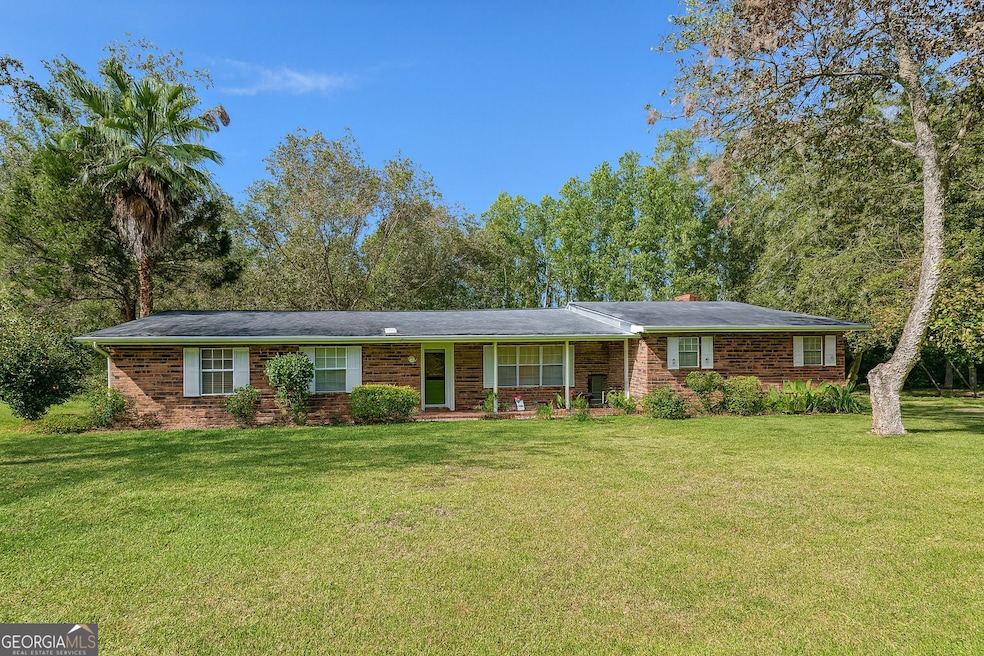
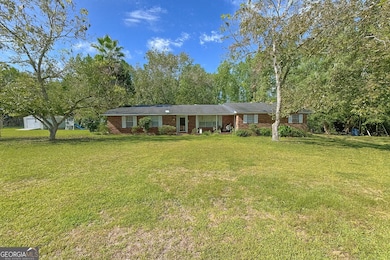
- Ranch Style House
- 1 Fireplace
About This Home
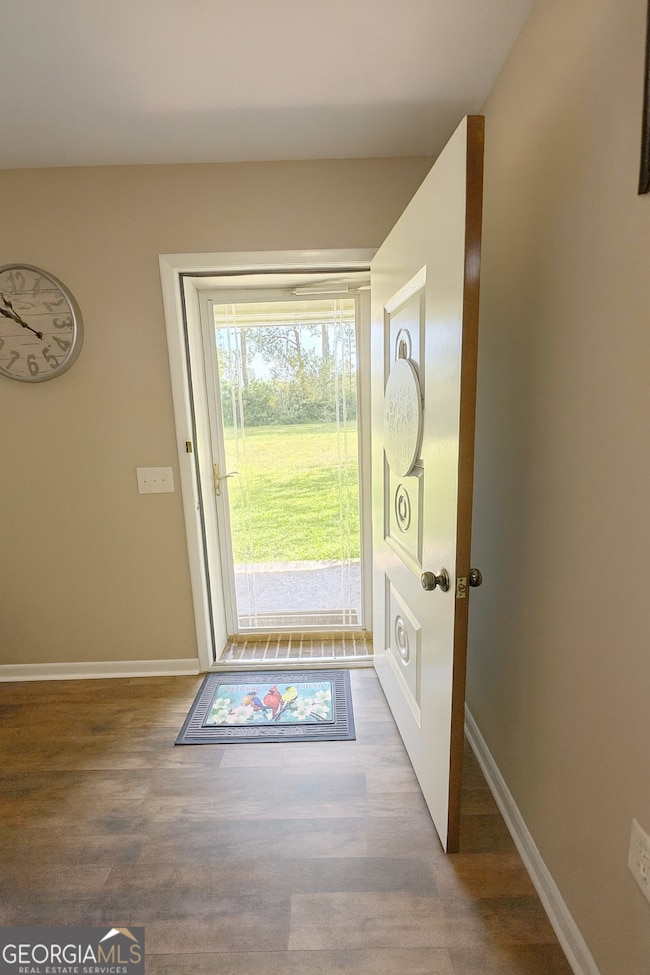
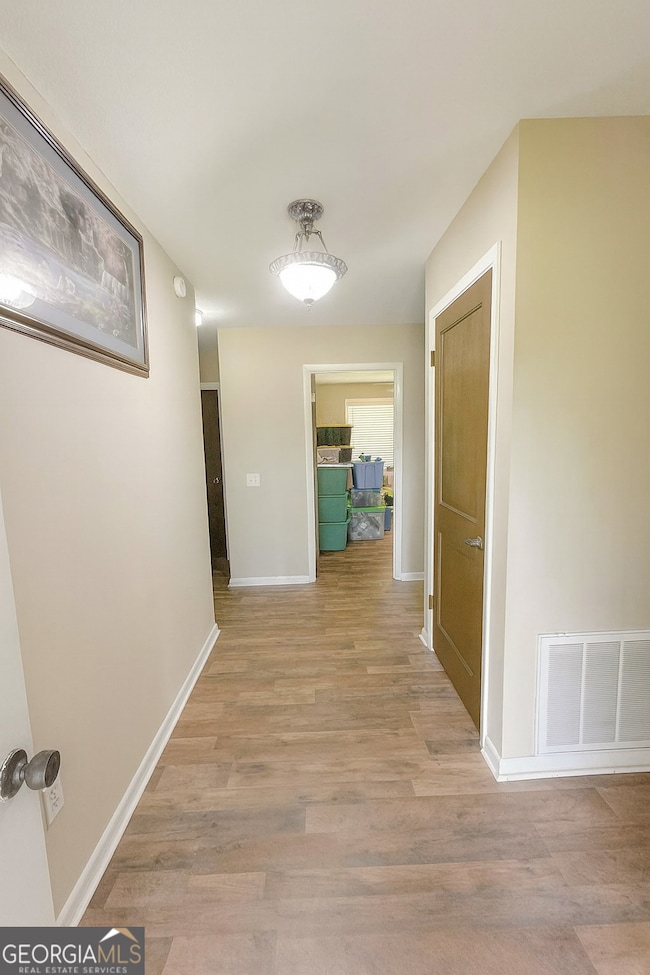
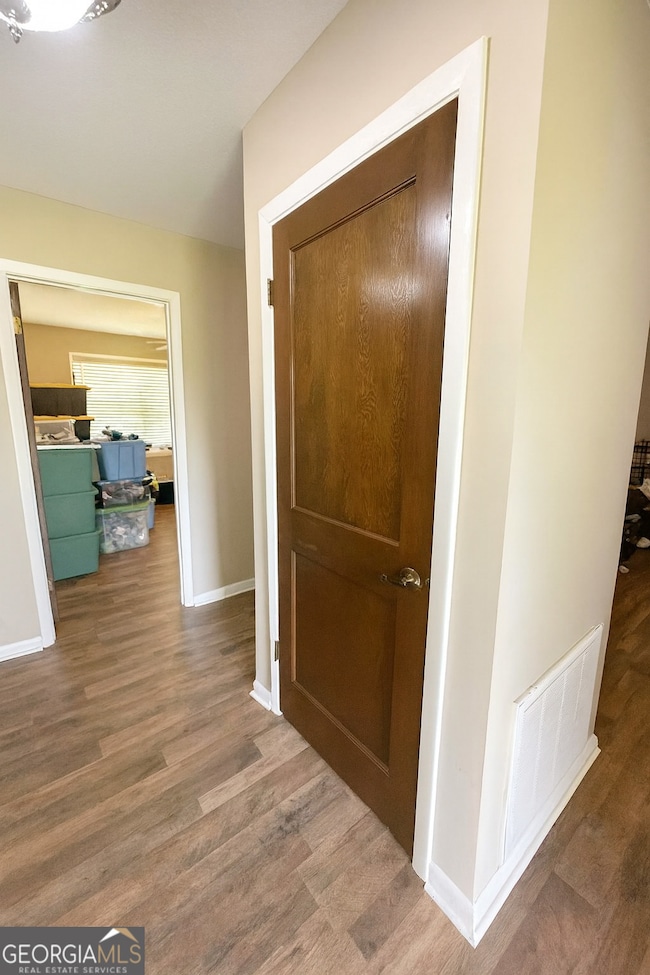
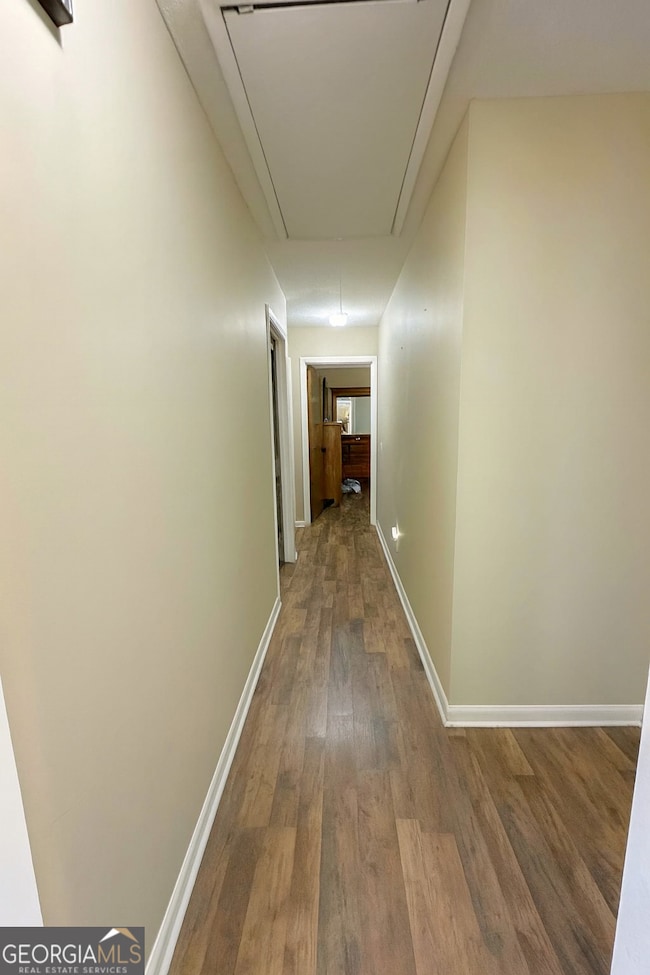
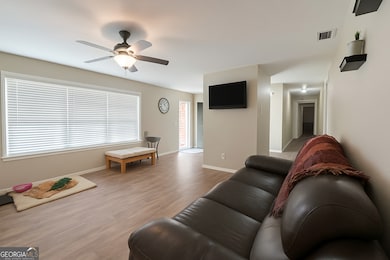
"FALL into freedom on 5 private acres - no HOA, no flood zone, and sellers ready to make a deal!" This charming 3-bedroom, 2-bath home offers space, style, and functionality with a large kitchen featuring an oversized island and abundant cabinet space, a formal dining room, and both a family and living room for flexible living. All bedrooms are generously sized with cedar-lined closets, and there's no carpet anywhere-just clean, easy-to-maintain flooring throughout. The oversized laundry room adds convenience, while recent updates including a 2-year-old HVAC and 6-year-old roof provide peace of mind. Outside, enjoy a fully fenced backyard with a separate animal pen or garden area, a 2-car attached garage, a 24x25 metal detached garage with lean-to, a powered workshop with A/C and water, and an additional storage shed. Whether you're seeking room to roam, space to work, or the freedom to live your way, this one checks every box.

Home Details
Home Type
- Single Family
Est. Annual Taxes
- $2,172
Year Built
- Built in 1970
Lot Details
- 5 Acre Lot
- Back Yard Fenced
- Chain Link Fence
- Private Lot
- Level Lot
- Open Lot
- Partially Wooded Lot
Home Design
- Ranch Style House
- Brick Exterior Construction
- Slab Foundation
- Brick Frame
- Composition Roof
Interior Spaces
- 1,825 Sq Ft Home
- Bookcases
- Beamed Ceilings
- High Ceiling
- Ceiling Fan
- 1 Fireplace
- Double Pane Windows
- Great Room
- Family Room
- Formal Dining Room
- Laminate Flooring
- Pull Down Stairs to Attic
Kitchen
- Oven or Range
- Microwave
- Dishwasher
Bedrooms and Bathrooms
- 3 Main Level Bedrooms
- Walk-In Closet
- 2 Full Bathrooms
Laundry
- Laundry in Mud Room
- Laundry Room
- Dryer
- Washer
Parking
- Garage
- Carport
- Side or Rear Entrance to Parking
- Off-Street Parking
- RV or Boat Parking
Outdoor Features
- Patio
- Separate Outdoor Workshop
- Shed
- Outbuilding
- Porch
Schools
- Odum Elementary School
- Martha Puckett Middle School
- Wayne County High School
Utilities
- Central Heating and Cooling System
- Well
- Electric Water Heater
- Septic Tank
- High Speed Internet
- Phone Available
- Cable TV Available
Additional Features
- Energy-Efficient Windows
- Pasture
Community Details
- No Home Owners Association
Map
Home Values in the Area
Average Home Value in this Area
Tax History
| Year | Tax Paid | Tax Assessment Tax Assessment Total Assessment is a certain percentage of the fair market value that is determined by local assessors to be the total taxable value of land and additions on the property. | Land | Improvement |
|---|---|---|---|---|
| 2024 | $2,040 | $82,008 | $9,650 | $72,358 |
| 2023 | $2,193 | $73,116 | $9,650 | $63,466 |
| 2022 | $1,910 | $60,667 | $9,650 | $51,017 |
| 2021 | $1,811 | $53,715 | $9,650 | $44,065 |
| 2020 | $1,885 | $54,025 | $9,960 | $44,065 |
| 2019 | $879 | $54,025 | $9,960 | $44,065 |
| 2018 | $879 | $54,025 | $9,960 | $44,065 |
| 2017 | $634 | $54,025 | $9,960 | $44,065 |
| 2016 | $585 | $54,025 | $9,960 | $44,065 |
| 2014 | $583 | $54,025 | $9,960 | $44,065 |
| 2013 | -- | $54,025 | $9,960 | $44,065 |
Property History
| Date | Event | Price | List to Sale | Price per Sq Ft |
|---|---|---|---|---|
| 10/23/2025 10/23/25 | Price Changed | $292,000 | -2.0% | $160 / Sq Ft |
| 09/22/2025 09/22/25 | For Sale | $298,000 | -- | $163 / Sq Ft |
Purchase History
| Date | Type | Sale Price | Title Company |
|---|---|---|---|
| Warranty Deed | $249,600 | -- | |
| Warranty Deed | $176,000 | -- | |
| Warranty Deed | -- | -- | |
| Deed | $100,000 | -- | |
| Deed | -- | -- |
Mortgage History
| Date | Status | Loan Amount | Loan Type |
|---|---|---|---|
| Open | $257,836 | New Conventional | |
| Previous Owner | $181,808 | No Value Available |
Source: Georgia MLS
MLS Number: 10610592
APN: 69-7
Disclaimer: Certain information contained herein is derived from information provided by parties other than Homes.com. All information provided is deemed reliable, but is not guaranteed to be accurate and should be independently verified.
![]() The data relating to real estate for sale on this web site comes in part from the Broker Reciprocity Program of Georgia MLS. Real estate listings held by brokerage firms other than Redfin are marked with the Broker Reciprocity logo and detailed information about them includes the name of the listing brokers. Information deemed reliable but not guaranteed. Copyright 2025 Georgia MLS. All rights reserved.
The data relating to real estate for sale on this web site comes in part from the Broker Reciprocity Program of Georgia MLS. Real estate listings held by brokerage firms other than Redfin are marked with the Broker Reciprocity logo and detailed information about them includes the name of the listing brokers. Information deemed reliable but not guaranteed. Copyright 2025 Georgia MLS. All rights reserved.
- 0 Oglethorpe Rd
- 88 Caleb Cir
- 818 Kaitlyn Ave
- 2936 Madray Springs Rd
- 556 Caleb Cir
- 131 Mill Creek Ln
- 143 Caleb Cir
- Lot 1,2,3 Rayonier Rd
- 1 Palm Island Cir
- 0 Palm Island Cir
- 96 Palm Tree Place
- 0 Red Oak Dr Unit 160341
- 0 Red Oak Dr Unit SA331365
- 98 Saint Simons St
- 75 Woodlawn Dr
- 186 Community Cir
- 95 Mayflower Rd
- 200 W Melody Dr
- 17380 Lanes Bridge Rd
- 267 Rodman Rd
- 895 S 1st St
- 284 E Pine St
- 890 E Cherry St Unit 102
- 775 Catherine St
- 110 Nobles Dr
- 45 Logan Ct SE
- 62 Whippoorwill Way NE
- 74 Quarter Horse Run NE
- 5448 Ga Highway 196
- 335 Archie Way NE
- 86 Carson St NE
- 235 Pine View Rd SE
- 172 Taylors Creek Dr
- 7 Upland Ct NE
- 452 Huntington Dr NE
- 68 Lincoln Way NE
- 41 Thicket Rd
- 102 Oliver Ln
- 114 Edgewood Rd