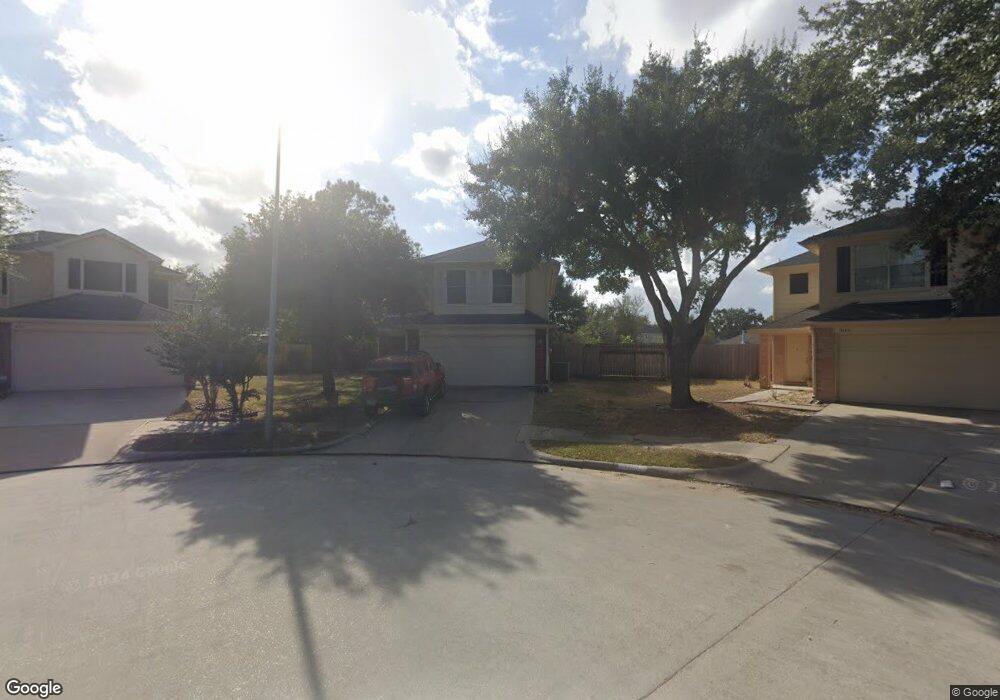
6555 Mccharen Ct Houston, TX 77086
North Houston NeighborhoodEstimated Value: $246,000 - $272,611
4
Beds
3
Baths
1,880
Sq Ft
$139/Sq Ft
Est. Value
About This Home
This home is located at 6555 Mccharen Ct, Houston, TX 77086 and is currently estimated at $261,403, approximately $139 per square foot. 6555 Mccharen Ct is a home located in Harris County with nearby schools including Kujawa EC/Pre-K/K School, Wilson Intermediate School, and Shotwell Middle School.
Ownership History
Date
Name
Owned For
Owner Type
Purchase Details
Closed on
Nov 24, 2010
Sold by
Fannie Mae
Bought by
Paz Audencio T
Current Estimated Value
Purchase Details
Closed on
Jan 5, 2010
Sold by
Uchefuna Gloria O
Bought by
Federal National Mortgage Association
Purchase Details
Closed on
Aug 24, 2004
Sold by
Luebano Edward P and Luebano Lynda Farias
Bought by
Uchefuna Gloria O
Home Financials for this Owner
Home Financials are based on the most recent Mortgage that was taken out on this home.
Original Mortgage
$96,000
Interest Rate
6%
Mortgage Type
Purchase Money Mortgage
Purchase Details
Closed on
Feb 4, 2000
Sold by
Kaufman & Broad Lone Star Lp
Bought by
Luebano Edward P and Luebano Lynda Farias
Home Financials for this Owner
Home Financials are based on the most recent Mortgage that was taken out on this home.
Original Mortgage
$94,941
Interest Rate
8.09%
Mortgage Type
FHA
Create a Home Valuation Report for This Property
The Home Valuation Report is an in-depth analysis detailing your home's value as well as a comparison with similar homes in the area
Home Values in the Area
Average Home Value in this Area
Purchase History
| Date | Buyer | Sale Price | Title Company |
|---|---|---|---|
| Paz Audencio T | -- | Texas American Title Company | |
| Federal National Mortgage Association | $97,137 | None Available | |
| Uchefuna Gloria O | -- | First American Title | |
| Luebano Edward P | -- | -- |
Source: Public Records
Mortgage History
| Date | Status | Borrower | Loan Amount |
|---|---|---|---|
| Previous Owner | Uchefuna Gloria O | $96,000 | |
| Previous Owner | Luebano Edward P | $94,941 |
Source: Public Records
Tax History Compared to Growth
Tax History
| Year | Tax Paid | Tax Assessment Tax Assessment Total Assessment is a certain percentage of the fair market value that is determined by local assessors to be the total taxable value of land and additions on the property. | Land | Improvement |
|---|---|---|---|---|
| 2025 | $5,003 | $277,265 | $48,103 | $229,162 |
| 2024 | $5,003 | $284,573 | $48,103 | $236,470 |
| 2023 | $5,003 | $284,573 | $49,046 | $235,527 |
| 2022 | $5,565 | $255,281 | $37,728 | $217,553 |
| 2021 | $5,047 | $207,844 | $37,728 | $170,116 |
| 2020 | $5,188 | $205,104 | $37,728 | $167,376 |
| 2019 | $4,903 | $174,694 | $26,032 | $148,662 |
| 2018 | $2,277 | $158,569 | $26,032 | $132,537 |
| 2017 | $4,018 | $148,449 | $23,391 | $125,058 |
| 2016 | $4,018 | $148,449 | $23,391 | $125,058 |
| 2015 | $3,026 | $129,292 | $23,391 | $105,901 |
| 2014 | $3,026 | $111,668 | $23,391 | $88,277 |
Source: Public Records
Map
Nearby Homes
- 6622 Sutton Meadows Dr
- 6411 Halstead Meadows Cir
- 10730 Antoine Dr
- 6706 Redding Springs Ln
- 0 Tomball Pkwy
- 6703 Deer Ridge Ln
- 7011 Lower Arrow Dr
- 6830 Desert Rose Ln
- 12610 Twilight Bend Ct
- 10214 Trade Winds Dr
- 5914 Stirring Winds Ln
- 6606 Dusty Dawn Dr
- 9815 Lonsford Dr
- 6822 Dusty Dawn Dr
- 10306 Jillana Kaye Dr
- 00 Romona Blvd
- 3265 Frick Rd
- 6911 Silver Star Dr
- 12623 Ann Louise Rd
- 6502 Trail Valley Way
- 6559 Mccharen Ct
- 6547 Mccharen Ct
- 6554 Bryant Park Ct
- 6546 Bryant Park Ct
- 6556 Mccharen Ct
- 6543 Mccharen Ct
- 6552 Mccharen Ct
- 6542 Bryant Park Ct
- 6548 Mccharen Ct
- 9810 Revelstoke Dr
- 9806 Revelstoke Dr
- 9814 Revelstoke Dr
- 6539 Mccharen Ct
- 6544 Mccharen Ct
- 9802 Revelstoke Dr
- 6555 Bryant Park Ct
- 9818 Revelstoke Dr
- 6538 Bryant Park Ct
- 6540 Mccharen Ct
- 6535 Mccharen Ct