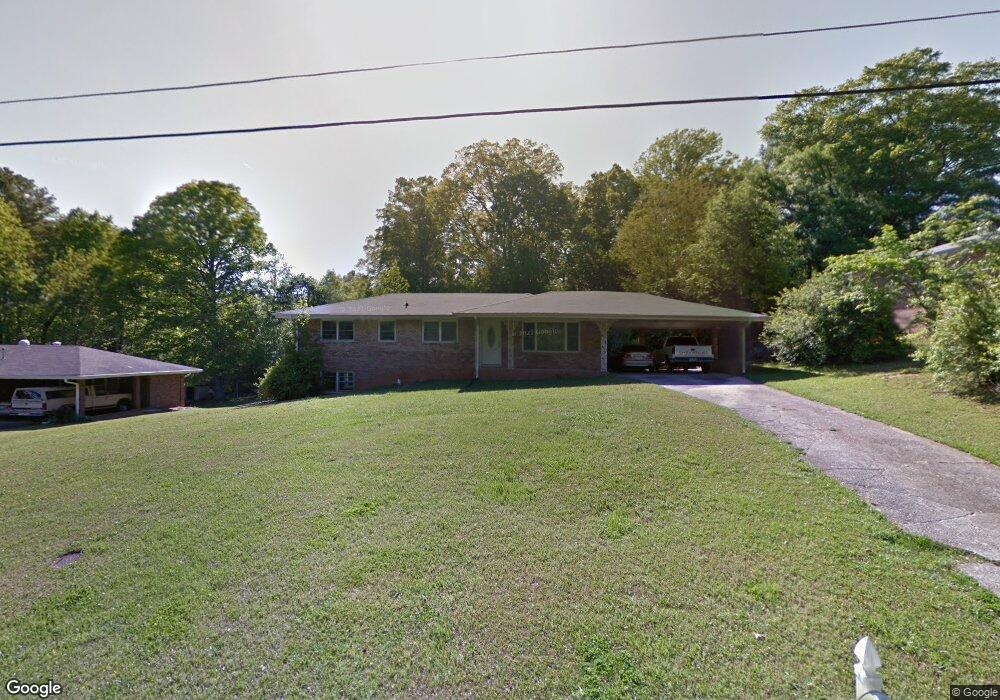
6556 S Dillon Rd Austell, GA 30168
Estimated Value: $238,232 - $274,000
3
Beds
2
Baths
1,250
Sq Ft
$205/Sq Ft
Est. Value
About This Home
This home is located at 6556 S Dillon Rd, Austell, GA 30168 and is currently estimated at $256,058, approximately $204 per square foot. 6556 S Dillon Rd is a home located in Cobb County with nearby schools including Bryant Elementary School, Lindley Middle School, and Pebblebrook High School.
Ownership History
Date
Name
Owned For
Owner Type
Purchase Details
Closed on
Apr 13, 2010
Sold by
Pfb Properties Llc
Bought by
Domenico Tina M
Current Estimated Value
Home Financials for this Owner
Home Financials are based on the most recent Mortgage that was taken out on this home.
Original Mortgage
$79,200
Outstanding Balance
$52,466
Interest Rate
4.97%
Mortgage Type
New Conventional
Estimated Equity
$203,592
Purchase Details
Closed on
May 20, 2008
Sold by
Beck Donnie R
Bought by
Pfb Properties Llc
Purchase Details
Closed on
Apr 1, 2008
Sold by
Arvest Bank
Bought by
Federal Home Loan Mortgage Corporation
Purchase Details
Closed on
Jun 11, 1998
Sold by
Garrett Lucile P
Bought by
Porter Edward E
Home Financials for this Owner
Home Financials are based on the most recent Mortgage that was taken out on this home.
Original Mortgage
$59,305
Interest Rate
7.21%
Mortgage Type
FHA
Create a Home Valuation Report for This Property
The Home Valuation Report is an in-depth analysis detailing your home's value as well as a comparison with similar homes in the area
Home Values in the Area
Average Home Value in this Area
Purchase History
| Date | Buyer | Sale Price | Title Company |
|---|---|---|---|
| Domenico Tina M | $99,000 | -- | |
| Pfb Properties Llc | $62,000 | -- | |
| Beck Donnie R | -- | -- | |
| Federal Home Loan Mortgage Corporation | -- | -- | |
| Arvest Bank | $94,123 | -- | |
| Porter Edward E | $20,000 | -- |
Source: Public Records
Mortgage History
| Date | Status | Borrower | Loan Amount |
|---|---|---|---|
| Open | Domenico Tina M | $79,200 | |
| Previous Owner | Porter Edward E | $59,305 |
Source: Public Records
Tax History
| Year | Tax Paid | Tax Assessment Tax Assessment Total Assessment is a certain percentage of the fair market value that is determined by local assessors to be the total taxable value of land and additions on the property. | Land | Improvement |
|---|---|---|---|---|
| 2025 | $465 | $91,248 | $18,000 | $73,248 |
| 2024 | $467 | $91,248 | $18,000 | $73,248 |
| 2023 | $261 | $91,248 | $18,000 | $73,248 |
Source: Public Records
Map
Nearby Homes
- 1576 S Gordon Rd
- 6595 Malvin Dr
- 6651 Malvin Dr
- 6445 Sherwood Trail
- 1405 Dillon Rd
- 6559 Brandemere Way
- 6563 Brandemere Way
- 1333 Laura Ln
- 1784 Brandemere Dr Unit 3
- 1151 S Gordon Rd
- 1310 Dillon Rd
- 1603 Pecan Log Place
- 6992 Ivy Pointe Row
- 1915 Cardell Rd Unit C15
- 6609 Crossing Creek Point
- 1202 Pisgah Rd SW
- 1979 Cardell Rd Unit 14
- 1489 Thunderwood Ln SW
- 840 Revena Dr
- 6854 Panda Ct Unit A
- 6546 S Dillon Rd
- 6570 S Dillon Rd
- 6545 S Dillon Rd
- 6528 S Dillon Rd
- 6557 Malvin Dr
- 6582 S Dillon Rd
- 6582 S Dillon Rd Unit Lot 6
- 6569 Malvin Dr
- 6543 Malvin Dr
- 1571 S Gordon Rd
- 6587 S Dillon Rd
- 6583 Malvin Dr
- 6596 S Dillon Rd
- 1583 S Gordon Rd
- 6595 S Dillon Rd
- 1529 S Gordon Rd
- 6606 S Dillon Rd
- 6570 Malvin Dr
- 6544 Malvin Dr
- 1570 S Gordon Rd
Your Personal Tour Guide
Ask me questions while you tour the home.