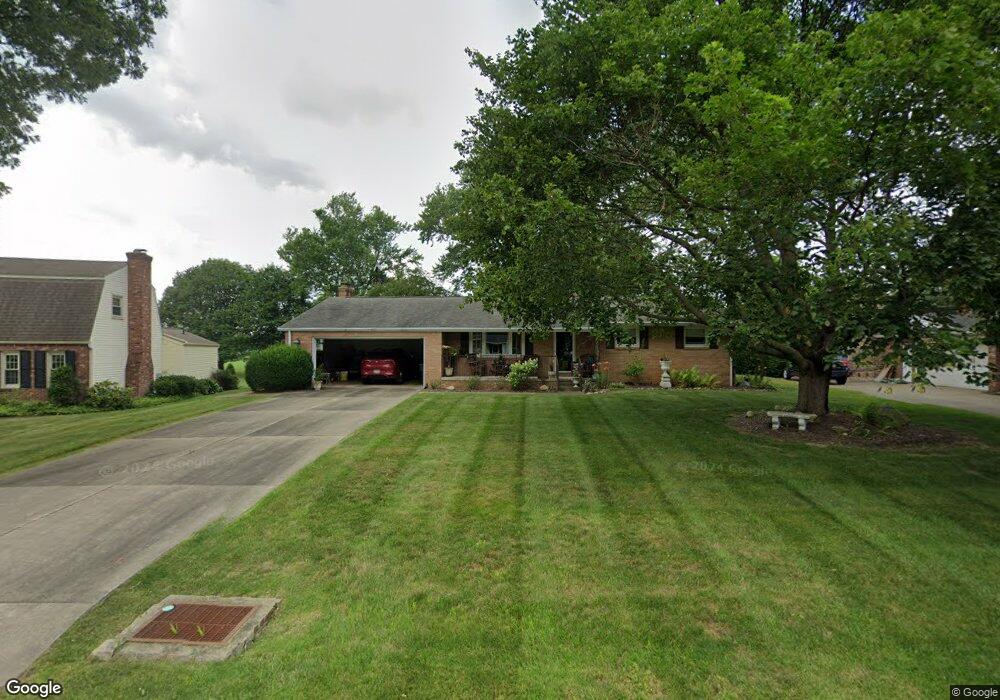
6559 Chesham Ave NE Canton, OH 44721
Estimated Value: $238,332 - $271,000
3
Beds
2
Baths
1,496
Sq Ft
$167/Sq Ft
Est. Value
About This Home
This home is located at 6559 Chesham Ave NE, Canton, OH 44721 and is currently estimated at $249,833, approximately $167 per square foot. 6559 Chesham Ave NE is a home located in Stark County with nearby schools including Charles L. Warstler Elementary School, Oakwood Middle School, and GlenOak High School.
Ownership History
Date
Name
Owned For
Owner Type
Purchase Details
Closed on
Apr 24, 2003
Sold by
Wolfert Richard A and Wolfert Joann
Bought by
Schweitzer Mary K
Current Estimated Value
Home Financials for this Owner
Home Financials are based on the most recent Mortgage that was taken out on this home.
Original Mortgage
$56,900
Outstanding Balance
$24,372
Interest Rate
5.71%
Mortgage Type
Purchase Money Mortgage
Estimated Equity
$225,461
Purchase Details
Closed on
Feb 28, 2002
Sold by
Miller Marilyn C and Miller Richard P
Bought by
Wolfert Joann and Wolfert Richard A
Home Financials for this Owner
Home Financials are based on the most recent Mortgage that was taken out on this home.
Original Mortgage
$128,500
Interest Rate
8%
Mortgage Type
Purchase Money Mortgage
Purchase Details
Closed on
Dec 19, 2000
Sold by
Estate Of Thomas R Grisez
Bought by
Grisez Catherine D
Purchase Details
Closed on
Dec 13, 2000
Sold by
Grisez Catherine D
Bought by
Grisez Catherine D and Miller Marilyn C
Create a Home Valuation Report for This Property
The Home Valuation Report is an in-depth analysis detailing your home's value as well as a comparison with similar homes in the area
Home Values in the Area
Average Home Value in this Area
Purchase History
| Date | Buyer | Sale Price | Title Company |
|---|---|---|---|
| Schweitzer Mary K | $141,900 | -- | |
| Wolfert Joann | $128,500 | -- | |
| Grisez Catherine D | -- | -- | |
| Grisez Catherine D | -- | -- |
Source: Public Records
Mortgage History
| Date | Status | Borrower | Loan Amount |
|---|---|---|---|
| Open | Schweitzer Mary K | $56,900 | |
| Previous Owner | Wolfert Joann | $128,500 |
Source: Public Records
Tax History Compared to Growth
Tax History
| Year | Tax Paid | Tax Assessment Tax Assessment Total Assessment is a certain percentage of the fair market value that is determined by local assessors to be the total taxable value of land and additions on the property. | Land | Improvement |
|---|---|---|---|---|
| 2025 | -- | $78,480 | $20,830 | $57,650 |
| 2024 | -- | $78,480 | $20,830 | $57,650 |
| 2023 | $2,029 | $52,720 | $11,940 | $40,780 |
| 2022 | $2,060 | $52,720 | $11,940 | $40,780 |
| 2021 | $2,069 | $52,720 | $11,940 | $40,780 |
| 2020 | $1,917 | $45,820 | $10,290 | $35,530 |
| 2019 | $1,901 | $45,820 | $10,290 | $35,530 |
| 2018 | $1,877 | $45,820 | $10,290 | $35,530 |
| 2017 | $1,815 | $41,660 | $9,630 | $32,030 |
| 2016 | $1,499 | $35,840 | $7,420 | $28,420 |
| 2015 | $1,449 | $35,840 | $7,420 | $28,420 |
| 2014 | $1,537 | $36,860 | $7,630 | $29,230 |
| 2013 | $751 | $36,860 | $7,630 | $29,230 |
Source: Public Records
Map
Nearby Homes
- 6914 Stonecreek Ave NE
- 3625 Alpine St NE
- 3240 Eastern St NE
- 6402 Blossomwood Cir NE
- 6428 Blossomwood Cir NE
- 3788 Psolla St NE
- 7106 Woodell Ave NE
- 3461 Donegal Dr NE
- 5907 Wiclif Rd NE
- 5700 Birmingham Rd NE
- 2550 Chaucer Dr NE
- 3339 Boettler St NE
- 6960 Middlebranch Ave NE
- 3426 Stoneleigh Rd NE
- 2690 Crompton St NE
- 6666 Carriage Lane Ave NE
- 6110 Glessner Ave NE
- 3151 Knollridge Cir NE
- 2511 58th St NE
- 6654 Windgate Ave NE
- 6575 Chesham Ave NE
- 6545 Chesham Ave NE
- 6535 Chesham Ave NE
- 6544 Chesham Dr NE
- 6544 Chesham Ave NE
- 6576 Chesham Dr NE
- 6605 Chesham Ave NE
- 6576 Chesham Ave NE
- 6515 Chesham Ave NE
- 6606 Chesham Ave NE
- 6510 Chesham Ave NE
- 3396 Easton St NE
- 6495 Chesham Ave NE
- 6470 Chesham Ave NE
- 6475 Chesham Ave NE
- 3343 Easton St NE
- 3363 Easton St NE
- 3323 Easton St NE
- 3377 Easton St NE
- 6450 Chesham Ave NE