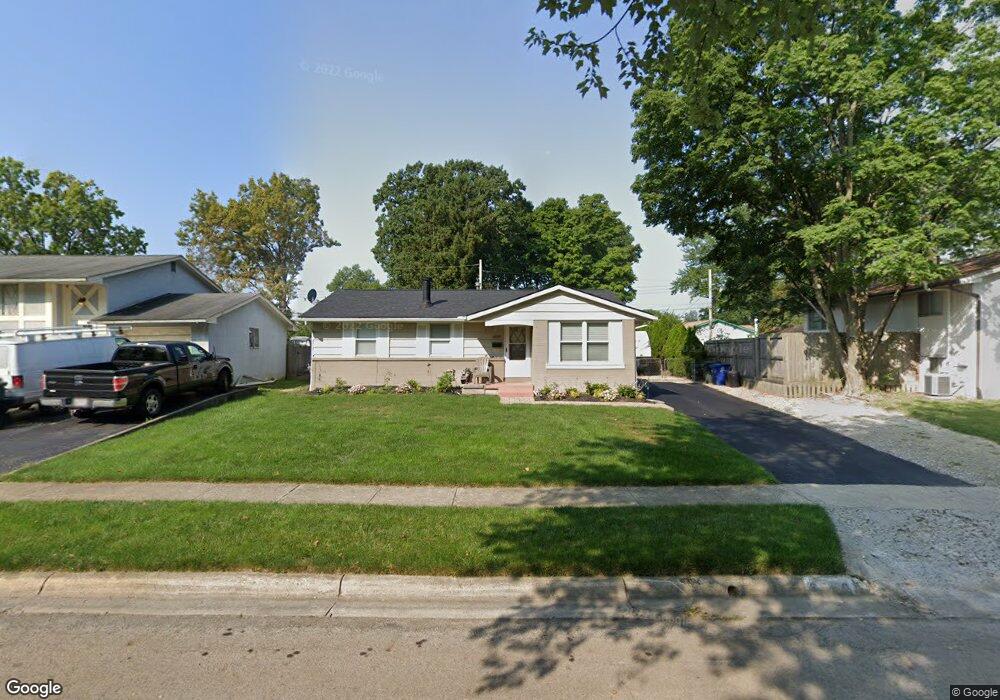
6559 Devonhill Rd Columbus, OH 43229
Devonshire NeighborhoodEstimated Value: $231,618 - $268,000
3
Beds
2
Baths
1,090
Sq Ft
$223/Sq Ft
Est. Value
About This Home
This home is located at 6559 Devonhill Rd, Columbus, OH 43229 and is currently estimated at $242,905, approximately $222 per square foot. 6559 Devonhill Rd is a home located in Franklin County with nearby schools including Devonshire Alternative Elementary School, Woodward Park Middle School, and Beechcroft High School.
Ownership History
Date
Name
Owned For
Owner Type
Purchase Details
Closed on
Jul 18, 2002
Sold by
Washkevich Michael J and Washkevich Nicole
Bought by
Corrigan Ross Susan
Current Estimated Value
Home Financials for this Owner
Home Financials are based on the most recent Mortgage that was taken out on this home.
Original Mortgage
$94,516
Outstanding Balance
$39,065
Interest Rate
6.91%
Mortgage Type
FHA
Estimated Equity
$203,840
Purchase Details
Closed on
Jul 30, 1998
Sold by
Wuelfing David J
Bought by
Washkevich Michael J and Washkevich Nicole
Home Financials for this Owner
Home Financials are based on the most recent Mortgage that was taken out on this home.
Original Mortgage
$85,000
Interest Rate
7.05%
Mortgage Type
FHA
Purchase Details
Closed on
Apr 7, 1994
Purchase Details
Closed on
Nov 1, 1984
Create a Home Valuation Report for This Property
The Home Valuation Report is an in-depth analysis detailing your home's value as well as a comparison with similar homes in the area
Home Values in the Area
Average Home Value in this Area
Purchase History
| Date | Buyer | Sale Price | Title Company |
|---|---|---|---|
| Corrigan Ross Susan | $96,000 | -- | |
| Washkevich Michael J | $85,900 | Chicago Title | |
| -- | -- | -- | |
| -- | $49,500 | -- |
Source: Public Records
Mortgage History
| Date | Status | Borrower | Loan Amount |
|---|---|---|---|
| Open | Corrigan Ross Susan | $94,516 | |
| Previous Owner | Washkevich Michael J | $85,000 |
Source: Public Records
Tax History
| Year | Tax Paid | Tax Assessment Tax Assessment Total Assessment is a certain percentage of the fair market value that is determined by local assessors to be the total taxable value of land and additions on the property. | Land | Improvement |
|---|---|---|---|---|
| 2025 | $3,308 | $73,710 | $17,710 | $56,000 |
| 2024 | $3,308 | $73,710 | $17,710 | $56,000 |
| 2023 | $3,266 | $73,710 | $17,710 | $56,000 |
| 2022 | $2,491 | $48,020 | $13,230 | $34,790 |
| 2021 | $2,495 | $48,020 | $13,230 | $34,790 |
| 2020 | $2,498 | $48,020 | $13,230 | $34,790 |
| 2019 | $2,308 | $38,050 | $10,570 | $27,480 |
| 2018 | $2,035 | $38,050 | $10,570 | $27,480 |
| 2017 | $2,126 | $38,050 | $10,570 | $27,480 |
| 2016 | $1,946 | $29,370 | $8,050 | $21,320 |
| 2015 | $1,766 | $29,370 | $8,050 | $21,320 |
| 2014 | $1,770 | $29,370 | $8,050 | $21,320 |
| 2013 | $970 | $32,620 | $8,925 | $23,695 |
Source: Public Records
Map
Nearby Homes
- 1421 Bosworth Place
- 1322 Bolenhill Ct
- 6416 Faircrest Rd
- 6336 Archmere Square E
- 6233 Karl Rd
- 6425 Deer Ridge Ln
- 1288 Oakfield Dr N
- 6162 Oakfield Dr E
- 6166 Harrington Ct
- 1852 Balsamridge Rd
- 6189 Northgap Dr
- 6211 Parkdale Dr
- 6148 Sharon Woods Blvd
- 6035 Karl Rd
- 1946 Rockdale Dr Unit 57
- 1947 Rockdale Dr Unit 33
- 6245 Sharon Woods Blvd
- 5990 Ambleside Dr
- 1390 E Dublin Granville Rd
- 6019 Beechcroft Rd
- 6551 Devonhill Rd
- 6541 Devonhill Rd
- 1400 Bosworth Ct
- 1400 Bosworth Ct
- 1394 Bosworth Ct
- 1394 Bosworth Ct
- 6556 Devonhill Rd
- 6548 Devonhill Rd
- 6568 Devonhill Rd
- 6533 Devonhill Rd
- 6581 Devonhill Rd
- 6540 Devonhill Rd
- 1420 Bosworth Place
- 1412 Bosworth Ct
- 1393 Bosworth Place
- 1412 Bosworth Place
- 6576 Devonhill Rd
- 1390 Bosworth Ct
- 1390 Bosworth Ct
- 1399 Bosworth Ct
Your Personal Tour Guide
Ask me questions while you tour the home.