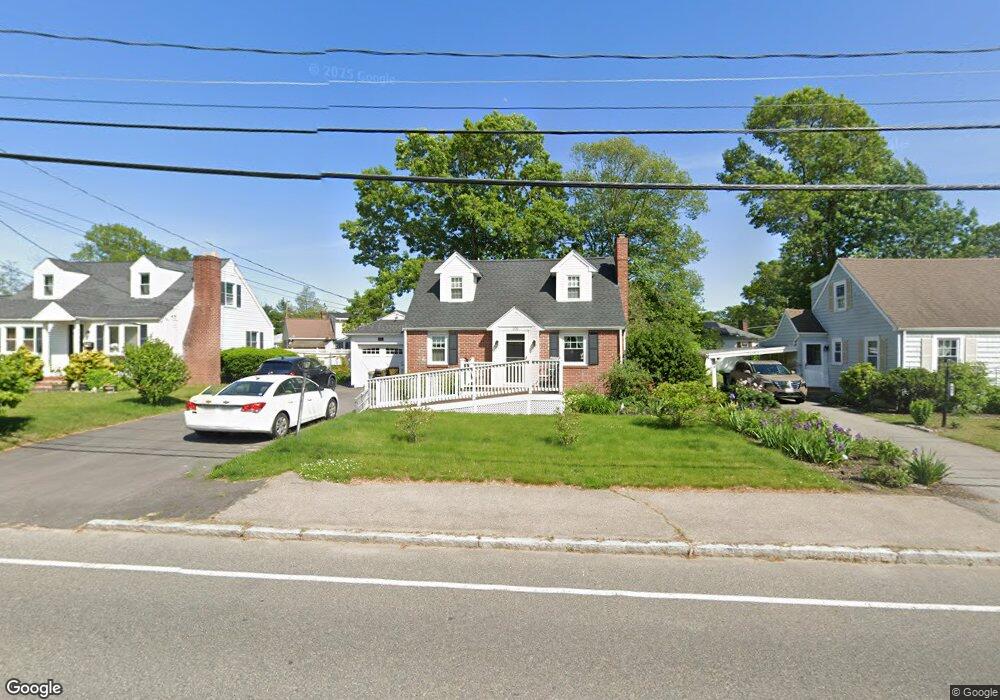
656 Ash St Brockton, MA 02301
Clifton Heights NeighborhoodEstimated Value: $455,000 - $519,000
2
Beds
2
Baths
1,225
Sq Ft
$387/Sq Ft
Est. Value
About This Home
This home is located at 656 Ash St, Brockton, MA 02301 and is currently estimated at $473,718, approximately $386 per square foot. 656 Ash St is a home located in Plymouth County with nearby schools including Gilmore Elementary School, John F. Kennedy Elementary School, and Davis K-8 School.
Ownership History
Date
Name
Owned For
Owner Type
Purchase Details
Closed on
Apr 24, 2000
Sold by
Boucher Brian and Boucher Amy B
Bought by
Boucher Debra L
Current Estimated Value
Home Financials for this Owner
Home Financials are based on the most recent Mortgage that was taken out on this home.
Original Mortgage
$144,000
Interest Rate
8.21%
Mortgage Type
Purchase Money Mortgage
Create a Home Valuation Report for This Property
The Home Valuation Report is an in-depth analysis detailing your home's value as well as a comparison with similar homes in the area
Home Values in the Area
Average Home Value in this Area
Purchase History
| Date | Buyer | Sale Price | Title Company |
|---|---|---|---|
| Boucher Debra L | $160,000 | -- |
Source: Public Records
Mortgage History
| Date | Status | Borrower | Loan Amount |
|---|---|---|---|
| Open | Boucher Debra L | $15,000 | |
| Open | Boucher Debra L | $137,000 | |
| Closed | Boucher Debra L | $144,000 | |
| Previous Owner | Boucher Debra L | $15,000 |
Source: Public Records
Tax History
| Year | Tax Paid | Tax Assessment Tax Assessment Total Assessment is a certain percentage of the fair market value that is determined by local assessors to be the total taxable value of land and additions on the property. | Land | Improvement |
|---|---|---|---|---|
| 2025 | $5,074 | $419,000 | $143,900 | $275,100 |
| 2024 | $4,833 | $402,100 | $143,900 | $258,200 |
| 2023 | $4,472 | $344,500 | $108,600 | $235,900 |
| 2022 | $4,433 | $317,300 | $98,600 | $218,700 |
| 2021 | $4,273 | $294,700 | $90,900 | $203,800 |
| 2020 | $4,212 | $278,000 | $87,400 | $190,600 |
| 2019 | $4,981 | $268,600 | $80,700 | $187,900 |
| 2018 | $4,715 | $242,200 | $80,700 | $161,500 |
| 2017 | $3,677 | $228,400 | $80,700 | $147,700 |
| 2016 | $3,370 | $194,100 | $73,000 | $121,100 |
| 2015 | $3,350 | $184,600 | $73,000 | $111,600 |
| 2014 | $3,225 | $177,900 | $73,000 | $104,900 |
Source: Public Records
Map
Nearby Homes
Your Personal Tour Guide
Ask me questions while you tour the home.