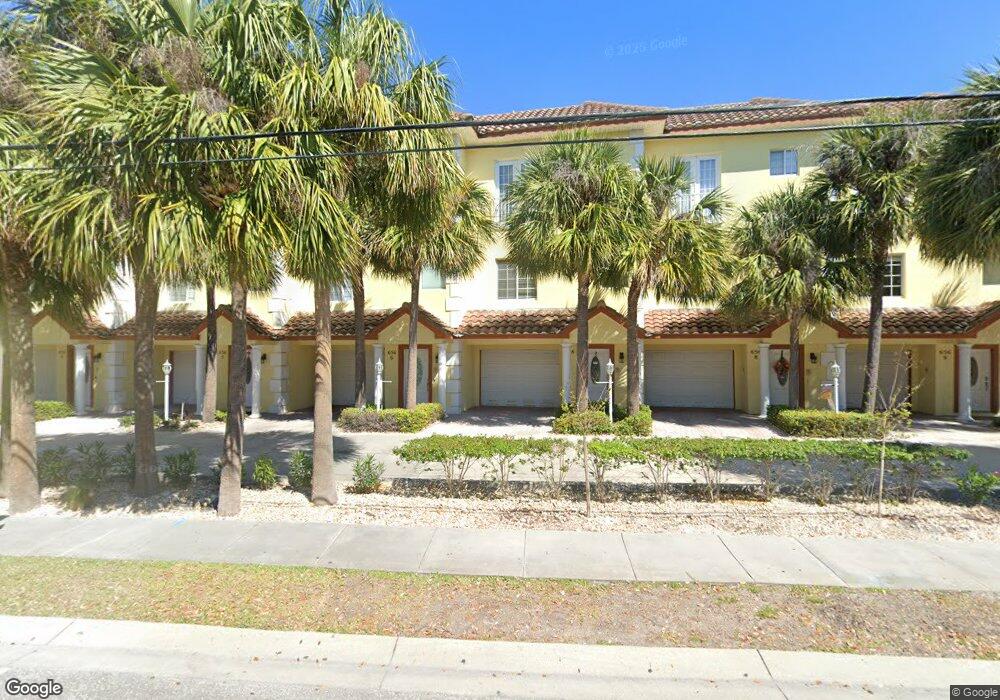
656 Bayway Blvd Unit 7 Clearwater Beach, FL 33767
Estimated Value: $1,154,539 - $1,288,000
3
Beds
3
Baths
2,265
Sq Ft
$541/Sq Ft
Est. Value
About This Home
This home is located at 656 Bayway Blvd Unit 7, Clearwater Beach, FL 33767 and is currently estimated at $1,224,385, approximately $540 per square foot. 656 Bayway Blvd Unit 7 is a home located in Pinellas County with nearby schools including Sandy Lane Elementary School, Dunedin Highland Middle School, and Clearwater High School.
Ownership History
Date
Name
Owned For
Owner Type
Purchase Details
Closed on
Jun 27, 2017
Sold by
Holsopple Ned
Bought by
Holsopple Ned Allen and The Nela Allen Holspopple Revo
Current Estimated Value
Purchase Details
Closed on
Jun 1, 2017
Bought by
Holsopple Ned Allen
Purchase Details
Closed on
Nov 8, 2016
Sold by
Sarramalho Daniel
Bought by
Holsopple Ned
Purchase Details
Closed on
Sep 30, 2010
Sold by
Williams Terry Lynn
Bought by
Kyres Constantine A and Chher Paul Sen
Purchase Details
Closed on
Dec 29, 2006
Sold by
Sailmate Investments Llc
Bought by
Williams Terry Lynn
Purchase Details
Closed on
Aug 16, 2004
Sold by
Carriera Bayway Llc
Bought by
Sailmate Investments Llc
Home Financials for this Owner
Home Financials are based on the most recent Mortgage that was taken out on this home.
Original Mortgage
$598,500
Interest Rate
6.25%
Mortgage Type
Purchase Money Mortgage
Create a Home Valuation Report for This Property
The Home Valuation Report is an in-depth analysis detailing your home's value as well as a comparison with similar homes in the area
Home Values in the Area
Average Home Value in this Area
Purchase History
| Date | Buyer | Sale Price | Title Company |
|---|---|---|---|
| Holsopple Ned Allen | -- | None Available | |
| Holsopple Ned Allen | $100 | -- | |
| Holsopple Ned | $587,500 | Title Usa Llc | |
| Kyres Constantine A | $385,900 | Star Title Partners Of Palm | |
| Williams Terry Lynn | $581,500 | Attorney | |
| Sailmate Investments Llc | $665,000 | -- |
Source: Public Records
Mortgage History
| Date | Status | Borrower | Loan Amount |
|---|---|---|---|
| Previous Owner | Sailmate Investments Llc | $598,500 |
Source: Public Records
Tax History Compared to Growth
Tax History
| Year | Tax Paid | Tax Assessment Tax Assessment Total Assessment is a certain percentage of the fair market value that is determined by local assessors to be the total taxable value of land and additions on the property. | Land | Improvement |
|---|---|---|---|---|
| 2024 | $2,828 | $426,430 | -- | -- |
| 2023 | $2,828 | $414,010 | $0 | $0 |
| 2022 | $2,751 | $401,951 | $0 | $0 |
| 2021 | $2,788 | $390,244 | $0 | $0 |
| 2020 | $2,781 | $384,856 | $0 | $0 |
| 2019 | $2,733 | $376,203 | $0 | $0 |
| 2018 | $2,696 | $369,188 | $0 | $0 |
| 2017 | $2,574 | $361,595 | $0 | $0 |
| 2016 | $11,152 | $538,172 | $0 | $0 |
| 2015 | $9,481 | $504,384 | $0 | $0 |
| 2014 | $8,561 | $446,140 | $0 | $0 |
Source: Public Records
Map
Nearby Homes
- 706 Bayway Blvd Unit 203
- 706 Bayway Blvd Unit 301
- 675 S Gulfview Blvd Unit 903
- 620 Bayway Blvd Unit 1
- 691 S Gulfview Blvd Unit 1412
- 691 S Gulfview Blvd Unit 1011
- 691 S Gulfview Blvd Unit 1508
- 691 S Gulfview Blvd Unit 1408
- 691 S Gulfview Blvd Unit 1211
- 691 S Gulfview Blvd Unit 1608
- 691 S Gulfview Blvd Unit 1212
- 600 Bayway Blvd Unit 304
- 800 Bayway Blvd Unit 14
- 800 Bayway Blvd Unit 28
- 800 S Gulfview Blvd Unit 101
- 800 S Gulfview Blvd Unit 403
- 530 S Gulfview Blvd Unit 205
- 530 S Gulfview Blvd Unit 304
- 530 S Gulfview Blvd Unit 303
- 530 S Gulfview Blvd Unit 805
- 656 Bayway Blvd Unit 11
- 656 Bayway Blvd Unit 10
- 656 Bayway Blvd
- 656 Bayway Blvd Unit 8
- 656 Bayway Blvd
- 656 Bayway Blvd Unit 5
- 656 Bayway Blvd Unit 4
- 656 Bayway Blvd
- 656 Bayway Blvd Unit 2
- 656 Bayway Blvd Unit 1
- 656 Bayway Blvd
- 656 Bayway Blvd Unit 3
- 656 Bayway Blvd Unit 9
- 656 Bayway Blvd Unit 6
- 674 Bayway Blvd
- 676 Bayway Blvd
- 678 Bayway Blvd
- 680 Bayway Blvd
- 682 Bayway Blvd
- 692 Bayway Blvd Unit 305