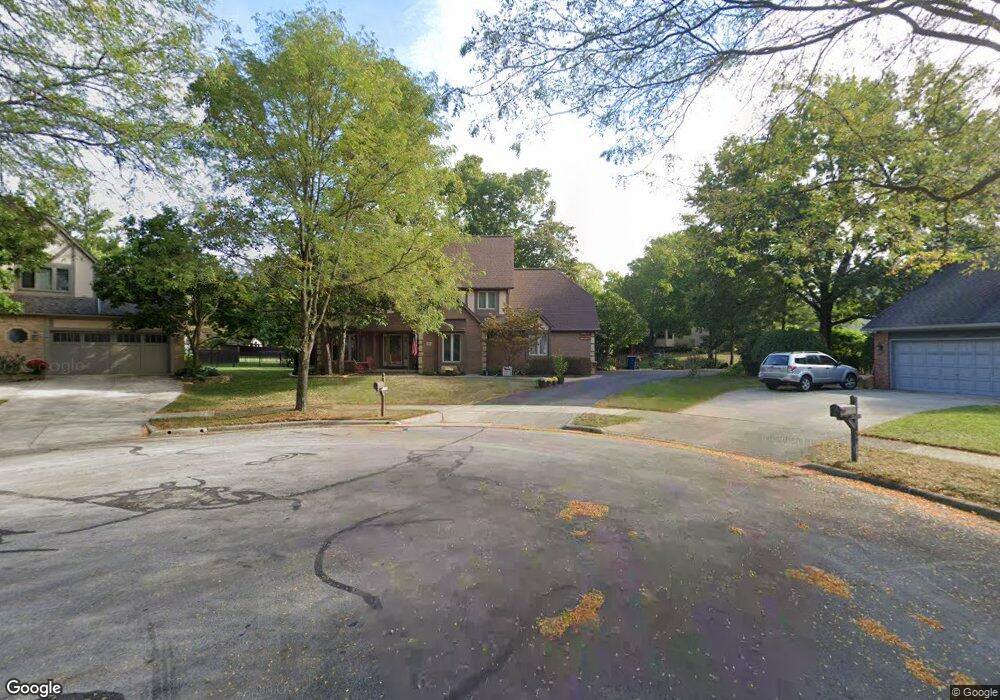
656 Hickory View Ct Westerville, OH 43081
Estimated Value: $520,980 - $545,000
4
Beds
3
Baths
2,405
Sq Ft
$219/Sq Ft
Est. Value
About This Home
This home is located at 656 Hickory View Ct, Westerville, OH 43081 and is currently estimated at $527,245, approximately $219 per square foot. 656 Hickory View Ct is a home located in Franklin County with nearby schools including Mcvay Elementary School, Walnut Springs Middle School, and Westerville-North High School.
Ownership History
Date
Name
Owned For
Owner Type
Purchase Details
Closed on
Mar 12, 2004
Sold by
Liv Craigmile Todd S and Liv Todd S Craigmile Revocable
Bought by
Craigmile Todd S and Craigmile Connie K
Current Estimated Value
Purchase Details
Closed on
Jan 14, 1999
Sold by
Craigmile Todd S and Craigmile Connie K
Bought by
Craigmile Connie K and Craigmile Revocable L Connie K
Purchase Details
Closed on
Jan 8, 1999
Sold by
Craigmile Todd S and Craigmile Connie K
Bought by
Liv Craigmile Todd S and Liv Todd S Craigmile Revocable
Purchase Details
Closed on
Aug 6, 1996
Sold by
David A Piedrich
Bought by
Craigmile Todd S and Craigmile Connie K
Home Financials for this Owner
Home Financials are based on the most recent Mortgage that was taken out on this home.
Original Mortgage
$137,200
Interest Rate
8.33%
Mortgage Type
New Conventional
Purchase Details
Closed on
Jun 12, 1990
Purchase Details
Closed on
Jun 1, 1986
Create a Home Valuation Report for This Property
The Home Valuation Report is an in-depth analysis detailing your home's value as well as a comparison with similar homes in the area
Home Values in the Area
Average Home Value in this Area
Purchase History
| Date | Buyer | Sale Price | Title Company |
|---|---|---|---|
| Craigmile Todd S | -- | -- | |
| Craigmile Connie K | -- | -- | |
| Liv Craigmile Todd S | -- | -- | |
| Craigmile Todd S | $196,000 | -- | |
| -- | $173,600 | -- | |
| -- | $146,500 | -- |
Source: Public Records
Mortgage History
| Date | Status | Borrower | Loan Amount |
|---|---|---|---|
| Closed | Craigmile Todd S | $137,200 |
Source: Public Records
Tax History Compared to Growth
Tax History
| Year | Tax Paid | Tax Assessment Tax Assessment Total Assessment is a certain percentage of the fair market value that is determined by local assessors to be the total taxable value of land and additions on the property. | Land | Improvement |
|---|---|---|---|---|
| 2024 | $8,848 | $155,680 | $34,930 | $120,750 |
| 2023 | $8,660 | $155,680 | $34,930 | $120,750 |
| 2022 | $7,923 | $108,750 | $21,000 | $87,750 |
| 2021 | $7,990 | $108,750 | $21,000 | $87,750 |
| 2020 | $7,967 | $108,750 | $21,000 | $87,750 |
| 2019 | $6,940 | $89,430 | $17,500 | $71,930 |
| 2018 | $6,778 | $89,430 | $17,500 | $71,930 |
| 2017 | $6,899 | $89,430 | $17,500 | $71,930 |
| 2016 | $6,973 | $83,170 | $19,780 | $63,390 |
| 2015 | $6,754 | $83,170 | $19,780 | $63,390 |
| 2014 | $6,759 | $83,170 | $19,780 | $63,390 |
| 2013 | $3,214 | $79,205 | $18,830 | $60,375 |
Source: Public Records
Map
Nearby Homes
- 613 Valley Wood Ct
- 1146 Forest Rise Dr
- 1003 Autumn Meadows Dr
- 750 Autumn Branch Rd
- 1209 Chatham Ridge Rd
- 994 Autumn Lake Ct
- 737 Autumn Branch Rd
- 1368 Nutmeg Ct
- 969 Farrington Dr
- 640 Brook Run Dr
- 800 S Spring Rd
- 539 Cherrington Rd
- 371 Delaware Dr
- 90 Spring Creek Dr
- 326 Peachtree Ct Unit 326D
- 693 Pointview Dr
- 6874 Flatlands Rd
- 192 Buckeye Ct
- 1015 Swanton Ct
- 1019 Swanton Ct
- 650 Hickory View Ct
- 635 Rockbridge Rd
- 629 Rockbridge Rd
- 659 Hickory View Ct
- 641 Rockbridge Rd
- 1029 Woodglen Rd
- 642 Hickory View Ct
- 1037 Woodglen Rd
- 655 Hickory View Ct
- 647 Rockbridge Rd
- 1023 Woodglen Rd
- 651 Hickory View Ct
- 1047 Woodglen Rd
- 638 Rockbridge Rd
- 1034 Autumn Crest Ct
- 655 Rockbridge Rd
- 628 Rockbridge Rd
- 648 Rockbridge Rd
- 1028 Autumn Crest Ct
- 613 Deer Run Rd