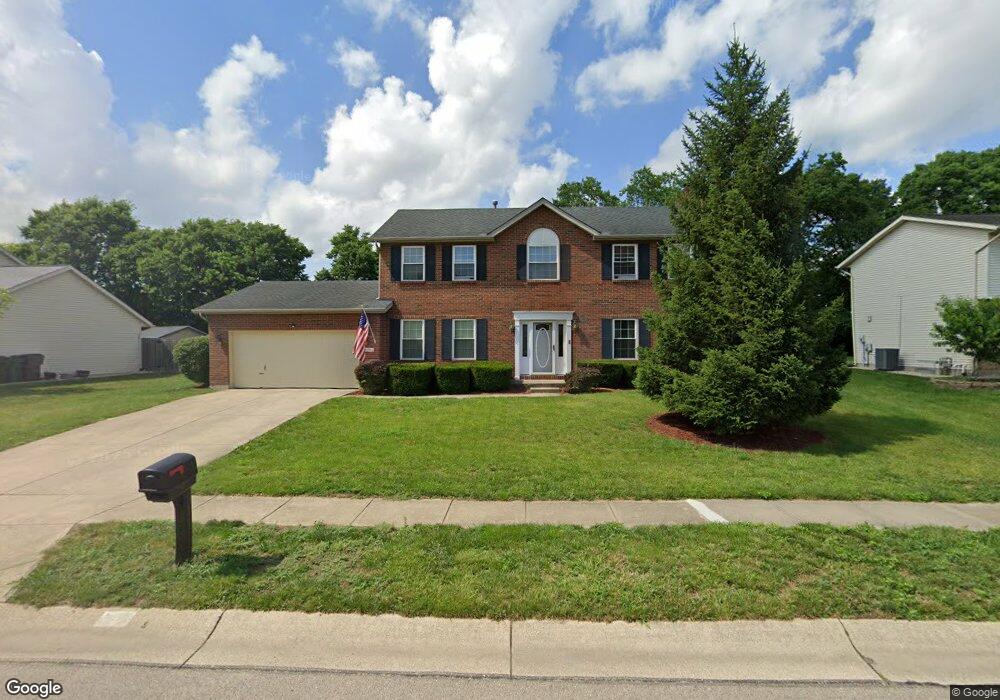
656 Innsbrooke Ln Hamilton, OH 45011
Estimated Value: $393,391 - $426,000
4
Beds
3
Baths
2,328
Sq Ft
$176/Sq Ft
Est. Value
About This Home
This home is located at 656 Innsbrooke Ln, Hamilton, OH 45011 and is currently estimated at $409,098, approximately $175 per square foot. 656 Innsbrooke Ln is a home located in Butler County with nearby schools including Compass Elementary School, Creekside Middle School, and Fairfield Senior High School.
Ownership History
Date
Name
Owned For
Owner Type
Purchase Details
Closed on
May 31, 2000
Sold by
Yuenger Marilyn S and Cain Marilyn
Bought by
Cook Jeffrey C and Cook Cheryl A
Current Estimated Value
Home Financials for this Owner
Home Financials are based on the most recent Mortgage that was taken out on this home.
Original Mortgage
$150,676
Outstanding Balance
$51,264
Interest Rate
8.56%
Mortgage Type
VA
Estimated Equity
$357,834
Purchase Details
Closed on
Sep 12, 1995
Sold by
Dixon Builders & Dev Inc
Bought by
Yuenger Christopher N and Yuenger Marilyn S
Home Financials for this Owner
Home Financials are based on the most recent Mortgage that was taken out on this home.
Original Mortgage
$107,100
Interest Rate
7.76%
Mortgage Type
New Conventional
Create a Home Valuation Report for This Property
The Home Valuation Report is an in-depth analysis detailing your home's value as well as a comparison with similar homes in the area
Home Values in the Area
Average Home Value in this Area
Purchase History
| Date | Buyer | Sale Price | Title Company |
|---|---|---|---|
| Cook Jeffrey C | $162,450 | First Title Ins Agency Inc | |
| Yuenger Christopher N | $133,908 | -- |
Source: Public Records
Mortgage History
| Date | Status | Borrower | Loan Amount |
|---|---|---|---|
| Open | Cook Jeffrey C | $150,676 | |
| Closed | Yuenger Christopher N | $107,100 |
Source: Public Records
Tax History
| Year | Tax Paid | Tax Assessment Tax Assessment Total Assessment is a certain percentage of the fair market value that is determined by local assessors to be the total taxable value of land and additions on the property. | Land | Improvement |
|---|---|---|---|---|
| 2025 | $4,181 | $113,510 | $14,070 | $99,440 |
| 2024 | $4,181 | $113,510 | $14,070 | $99,440 |
| 2023 | $4,161 | $113,510 | $14,070 | $99,440 |
| 2022 | $3,618 | $75,760 | $14,070 | $61,690 |
| 2021 | $3,127 | $74,550 | $14,070 | $60,480 |
| 2020 | $3,252 | $74,550 | $14,070 | $60,480 |
| 2019 | $5,255 | $60,860 | $14,280 | $46,580 |
| 2018 | $3,016 | $60,860 | $14,280 | $46,580 |
| 2017 | $3,046 | $60,860 | $14,280 | $46,580 |
| 2016 | $2,879 | $54,770 | $14,280 | $40,490 |
| 2015 | $2,741 | $54,770 | $14,280 | $40,490 |
| 2014 | $2,636 | $54,770 | $14,280 | $40,490 |
| 2013 | $2,636 | $55,280 | $14,280 | $41,000 |
Source: Public Records
Map
Nearby Homes
- 3835 Schroeder Dr
- 895 Millers Run Ct
- 7885 Jessies Way
- 4058 Schroeder Dr
- 7893 Jessies Way
- 7918 Jessies Way Unit 304
- 7918 Jessies Way
- 3798 Riverdowns Ct
- 4217 W Arbor Terrace
- 8400 S Port Dr
- 4210 Tylers Estates Dr
- 4257 Primary Colors
- 4224 College Dictionary
- 4401 E Observatory
- 4387 Tylers Estates Dr
- 7249 Woodberry Dr
- 7531 Tylers Hill Ct
- 7225 Woodberry Dr
- 7611 Tylers Hill Ct
- 4212 R E Smith Dr
- 648 Innsbrooke Ln
- 664 Innsbrooke Ln
- 3817 Schroeder Dr
- 3827 Schroeder Dr
- 640 Innsbrooke Ln
- 672 Innsbrooke Ln
- 3809 Schroeder Dr
- 653 Innsbrooke Ln
- 661 Innsbrooke Ln
- 645 Innsbrooke Ln
- 669 Innsbrooke Ln
- 3799 Schroeder Dr
- 632 Innsbrooke Ln
- 677 Innsbrooke Ln
- 3845 Schroeder Dr
- 680 Innsbrooke Ln
- 810 Millers Run Ct
- 3791 Schroeder Dr
- 805 Millers Run Ct
- 3853 Schroeder Dr
Your Personal Tour Guide
Ask me questions while you tour the home.