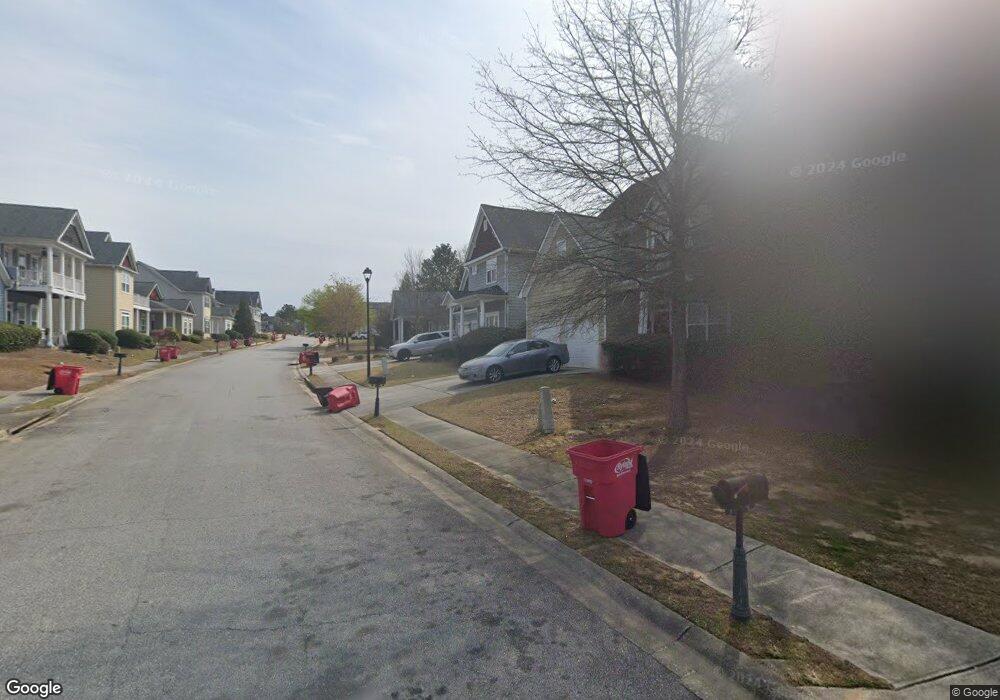
656 Ivy Brook Way Macon, GA 31210
Estimated Value: $207,526 - $225,000
3
Beds
2
Baths
1,868
Sq Ft
$115/Sq Ft
Est. Value
About This Home
This home is located at 656 Ivy Brook Way, Macon, GA 31210 and is currently estimated at $214,632, approximately $114 per square foot. 656 Ivy Brook Way is a home located in Bibb County with nearby schools including Carter Elementary School, Howard Middle School, and Howard High School.
Ownership History
Date
Name
Owned For
Owner Type
Purchase Details
Closed on
Jun 30, 2009
Sold by
Hill Mcarthur and Hill Marcus
Bought by
Sylvester Keith
Current Estimated Value
Home Financials for this Owner
Home Financials are based on the most recent Mortgage that was taken out on this home.
Original Mortgage
$116,844
Outstanding Balance
$73,586
Interest Rate
4.79%
Mortgage Type
FHA
Estimated Equity
$141,046
Purchase Details
Closed on
Jun 1, 2005
Sold by
Hill Mcarthur
Bought by
Hill Mcaratur and The Mcartur Hill Living Trust
Purchase Details
Closed on
Mar 15, 2005
Home Financials for this Owner
Home Financials are based on the most recent Mortgage that was taken out on this home.
Original Mortgage
$113,752
Interest Rate
8%
Mortgage Type
Adjustable Rate Mortgage/ARM
Purchase Details
Closed on
Aug 31, 2004
Create a Home Valuation Report for This Property
The Home Valuation Report is an in-depth analysis detailing your home's value as well as a comparison with similar homes in the area
Home Values in the Area
Average Home Value in this Area
Purchase History
| Date | Buyer | Sale Price | Title Company |
|---|---|---|---|
| Sylvester Keith | $119,000 | None Available | |
| Hill Mcaratur | -- | None Avelable | |
| -- | $142,200 | -- | |
| Hill Mcarthur | $142,190 | None Available | |
| -- | $250,000 | -- |
Source: Public Records
Mortgage History
| Date | Status | Borrower | Loan Amount |
|---|---|---|---|
| Open | Sylvester Keith | $116,844 | |
| Previous Owner | Hill Mcarthur | $113,752 | |
| Previous Owner | -- | $28,438 |
Source: Public Records
Tax History Compared to Growth
Tax History
| Year | Tax Paid | Tax Assessment Tax Assessment Total Assessment is a certain percentage of the fair market value that is determined by local assessors to be the total taxable value of land and additions on the property. | Land | Improvement |
|---|---|---|---|---|
| 2025 | $1,703 | $76,311 | $8,000 | $68,311 |
| 2024 | $1,595 | $69,805 | $8,000 | $61,805 |
| 2023 | $1,138 | $69,805 | $8,000 | $61,805 |
| 2022 | $2,051 | $66,249 | $12,400 | $53,849 |
| 2021 | $1,756 | $53,215 | $10,136 | $43,079 |
| 2020 | $2,030 | $52,279 | $10,136 | $42,143 |
| 2019 | $1,741 | $44,484 | $7,240 | $37,244 |
| 2018 | $2,620 | $40,707 | $7,240 | $33,467 |
| 2017 | $1,525 | $40,707 | $7,240 | $33,467 |
| 2016 | $1,408 | $40,707 | $7,240 | $33,467 |
| 2015 | $1,993 | $40,707 | $7,240 | $33,467 |
| 2014 | $1,997 | $40,707 | $7,240 | $33,467 |
Source: Public Records
Map
Nearby Homes
- 715 Ivy Brook Way
- 2006 Fall Harvest Dr Unit LOT 278
- 2002 Fall Harvest Dr Unit LOT 280
- 2006 Fall Harvest Dr
- 2002 Fall Harvest Dr
- 2008 Fall Harvest Dr Unit LOT 277
- 2004 Fall Harvest Dr
- 2010 Fall Harvest Dr Unit LOT 276
- 2010 Fall Harvest Dr
- 2008 Fall Harvest Dr
- 2004 Fall Harvest Dr Unit LOT 279
- 740 Ivy Brook Way
- 631 Ivy Brook Way
- 776 Ivy Brook Way
- 621 Ivy Brook Way
- 534 Ivy Brook Way
- 117 Legare Ct
- 4508 Bon Ayer Cir
- 658 Ivy Brook Way
- 660 Ivy Brook Way
- 662 Ivy Brook Way
- 648 Ivy Brook Way
- 655 Ivy Brook Way
- 664 Ivy Brook Way
- 657 Ivy Brook Way
- 657 Ivy Brook Way Unit 70
- 653 Ivy Brook Way
- 659 Ivy Brook Way
- 651 Ivy Brook Way
- 661 Ivy Brook Way
- 649 Ivy Brook Way
- 646 Ivy Brook Way
- 668 Ivy Brook Way
- 668 Ivy Brook Way Unit 11
- 647 Ivy Brook Way
- 677 Ivy Brook Way
- 644 Ivy Brook Way
- 645 Ivy Brook Way