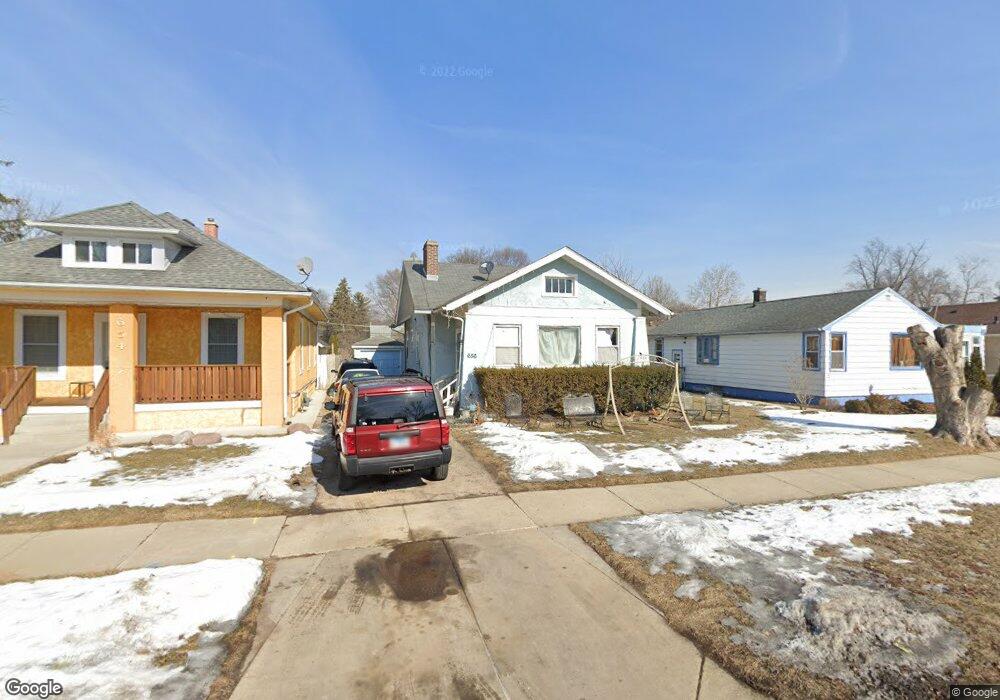
656 Jay St Elgin, IL 60120
Southeast Elgin NeighborhoodEstimated Value: $184,000 - $259,000
About This Home
This home is located at 656 Jay St, Elgin, IL 60120 and is currently estimated at $213,786, approximately $212 per square foot. 656 Jay St is a home located in Kane County with nearby schools including Huff Elementary School, Ellis Middle School, and Elgin High School.
Ownership History
We collect this data history from publicly available records. To have your information removed, we recommend requesting removal directly through your county’s website.
Purchase Details
Purchase Details
Home Financials for this Owner
Home Financials are based on the most recent Mortgage that was taken out on this home.Home Values in the Area
Average Home Value in this Area
Purchase History
We collect this data history from publicly available records. To have your information removed, we recommend requesting removal directly through your county’s website.
| Date | Buyer | Sale Price | Title Company |
|---|---|---|---|
| -- | None Listed On Document | ||
| $97,500 | -- |
Mortgage History
We collect this data history from publicly available records. To have your information removed, we recommend requesting removal directly through your county’s website.
| Date | Status | Borrower | Loan Amount |
|---|---|---|---|
| Previous Owner | $96,779 |
Tax History
We collect this data history from publicly available records. To have your information removed, we recommend requesting removal directly through your county’s website.
| Year | Tax Paid | Tax Assessment Tax Assessment Total Assessment is a certain percentage of the fair market value that is determined by local assessors to be the total taxable value of land and additions on the property. | Land | Improvement |
|---|---|---|---|---|
| 2024 | $4,716 | $58,925 | $13,204 | $45,721 |
| 2023 | $4,538 | $53,234 | $11,929 | $41,305 |
| 2022 | $4,209 | $48,540 | $10,877 | $37,663 |
| 2021 | $4,049 | $45,381 | $10,169 | $35,212 |
| 2020 | $3,805 | $41,722 | $9,708 | $32,014 |
| 2019 | $3,712 | $39,742 | $9,247 | $30,495 |
| 2018 | $3,361 | $33,995 | $8,711 | $25,284 |
| 2017 | $3,305 | $32,137 | $8,235 | $23,902 |
| 2016 | $3,180 | $29,815 | $7,640 | $22,175 |
| 2015 | -- | $27,328 | $7,003 | $20,325 |
| 2014 | -- | $26,991 | $6,917 | $20,074 |
| 2013 | -- | $31,339 | $7,099 | $24,240 |
Map
- Lot 3 Russell St
- 415 Russell St
- 555 S Liberty St
- 870 Lavoie Ave
- 513 Cookane Ave
- 662 Bent St
- 433 Arlington Ave
- 907 Houston Ave
- 953 Elizabeth St
- 700 Villa St
- 255 Bartlett Place
- 394 Woodview Cir Unit B
- 383 Woodview Cir Unit A
- 402 Woodview Cir Unit D
- 217 Michigan St
- 1101 Yorkshire Ct Unit D
- 17 S Liberty St
- 1103 Stratford Ct Unit C
- 1609 Deer Pointe Dr
- 153 Dawson Dr
Ask me questions while you tour the home.