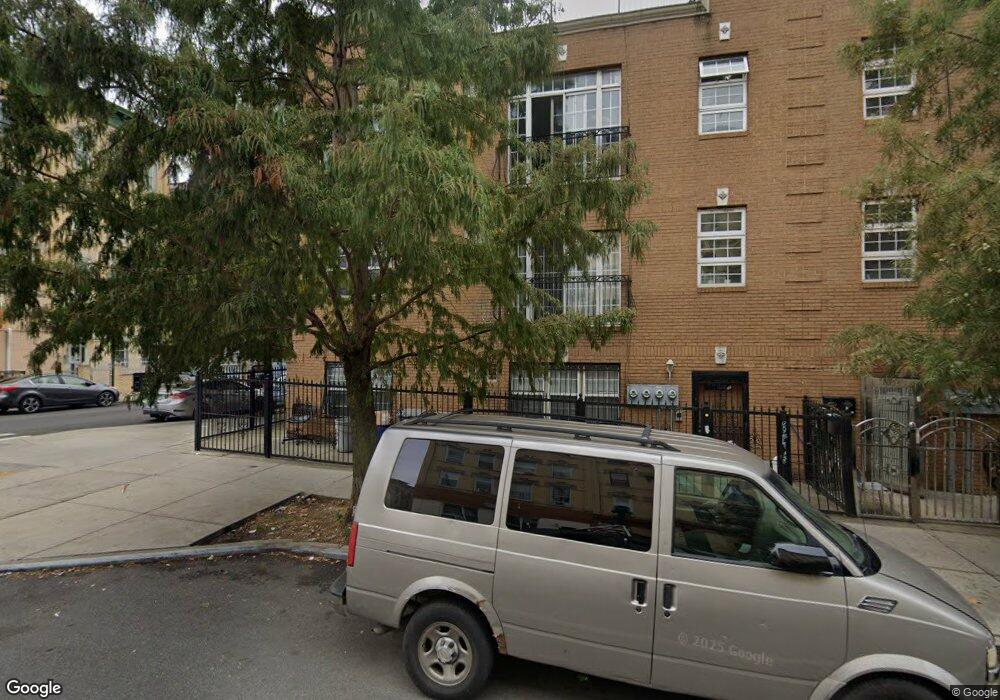
656 Knickerbocker Ave Brooklyn, NY 11221
Bushwick NeighborhoodEstimated Value: $1,388,619 - $1,749,000
Studio
--
Bath
2,694
Sq Ft
$588/Sq Ft
Est. Value
About This Home
This home is located at 656 Knickerbocker Ave, Brooklyn, NY 11221 and is currently estimated at $1,584,155, approximately $588 per square foot. 656 Knickerbocker Ave is a home located in Kings County with nearby schools including P.S. 106 Edward Everett Hale, J.H.S. 291 Roland Hayes, and Success Academy Charter School-NYC 9.
Ownership History
Date
Name
Owned For
Owner Type
Purchase Details
Closed on
Nov 29, 2017
Sold by
Torres Andy R
Bought by
728 Lorimer Street Llc
Current Estimated Value
Home Financials for this Owner
Home Financials are based on the most recent Mortgage that was taken out on this home.
Original Mortgage
$700,000
Outstanding Balance
$586,569
Interest Rate
3.94%
Mortgage Type
Purchase Money Mortgage
Estimated Equity
$997,586
Purchase Details
Closed on
Jun 8, 2010
Sold by
Usa Property 26 Llc
Bought by
Torres Andy R
Home Financials for this Owner
Home Financials are based on the most recent Mortgage that was taken out on this home.
Original Mortgage
$623,498
Interest Rate
5.25%
Mortgage Type
FHA
Purchase Details
Closed on
Aug 28, 1995
Sold by
Perez Juan
Bought by
Perez Luis and Perez Martha M
Create a Home Valuation Report for This Property
The Home Valuation Report is an in-depth analysis detailing your home's value as well as a comparison with similar homes in the area
Home Values in the Area
Average Home Value in this Area
Purchase History
| Date | Buyer | Sale Price | Title Company |
|---|---|---|---|
| 728 Lorimer Street Llc | $1,160,000 | -- | |
| 728 Lorimer Street Llc | $1,160,000 | -- | |
| 728 Lorimer Street Llc | $1,160,000 | -- | |
| Torres Andy R | $635,000 | -- | |
| Torres Andy R | $635,000 | -- | |
| Perez Luis | $17,500 | -- | |
| Perez Luis | -- | -- |
Source: Public Records
Mortgage History
| Date | Status | Borrower | Loan Amount |
|---|---|---|---|
| Open | 728 Lorimer Street Llc | $700,000 | |
| Closed | 728 Lorimer Street Llc | $700,000 | |
| Previous Owner | Torres Andy R | $623,498 |
Source: Public Records
Tax History
| Year | Tax Paid | Tax Assessment Tax Assessment Total Assessment is a certain percentage of the fair market value that is determined by local assessors to be the total taxable value of land and additions on the property. | Land | Improvement |
|---|---|---|---|---|
| 2025 | $10,256 | $88,320 | $2,820 | $85,500 |
| 2024 | $10,256 | $81,420 | $2,820 | $78,600 |
| 2023 | $10,125 | $98,340 | $2,820 | $95,520 |
| 2022 | $9,952 | $107,760 | $2,820 | $104,940 |
| 2021 | $10,061 | $84,540 | $2,820 | $81,720 |
| 2020 | $4,719 | $70,680 | $2,820 | $67,860 |
| 2019 | $8,901 | $75,120 | $2,820 | $72,300 |
| 2018 | $8,469 | $41,544 | $2,257 | $39,287 |
| 2017 | $8,469 | $41,544 | $2,179 | $39,365 |
| 2016 | $7,964 | $39,840 | $2,820 | $37,020 |
| 2015 | $4,727 | $37,587 | $2,067 | $35,520 |
| 2014 | $4,727 | $35,460 | $2,340 | $33,120 |
Source: Public Records
Map
Nearby Homes
- 1391 Putnam Ave
- 321 Cornelia St
- 1245 Madison St
- 1234 Madison St
- 1318 Putnam Ave
- 1324 Jefferson Ave
- 1493 Putnam Ave
- 265 Weirfield St Unit PH-A
- 265 Weirfield St Unit PH-B
- 265 Weirfield St Unit Garden B
- 265 Weirfield St Unit Garden A
- 265 Weirfield St Unit 2-A
- 1242 Hancock St Unit 3
- 1242 Hancock St Unit 1
- 341 Weirfield St
- 1285 Putnam Ave
- 302 Weirfield St
- 189 Cornelia St
- 479 Irving Ave
- 300 Linden St
- 656 Knickerbocker Ave Unit 2
- 656 Knickerbocker Ave Unit 1
- 1389 Putnam Ave
- 654 Knickerbocker Ave
- 1387 Putnam Ave
- 1385 Putnam Ave
- 652 Knickerbocker Ave
- 1383 Putnam Ave
- 657 Knickerbocker Ave Unit 2-B
- 657 Knickerbocker Ave Unit 1-R
- 657 Knickerbocker Ave
- 664 Knickerbocker Ave
- 1381 Putnam Ave
- 660 Knickerbocker Ave
- 1394 Putnam Ave Unit 4
- 655 Knickerbocker Ave
- 1390 Putnam Ave
- 1390 Putnam Ave
- 1390 Putnam Ave Unit 1R
- 1390 Putnam Ave Unit 2R
Your Personal Tour Guide
Ask me questions while you tour the home.