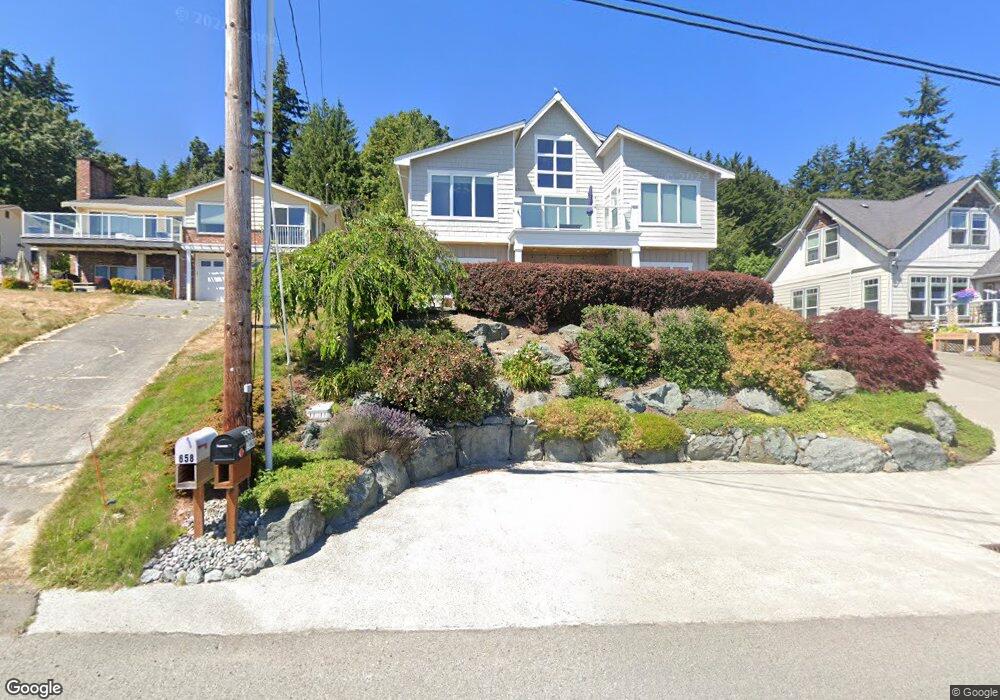
656 Lehman Dr Unit A Camano Island, WA 98282
Estimated Value: $1,389,000 - $1,899,000
1
Bed
6
Baths
4,230
Sq Ft
$409/Sq Ft
Est. Value
About This Home
This home is located at 656 Lehman Dr Unit A, Camano Island, WA 98282 and is currently estimated at $1,731,011, approximately $409 per square foot. 656 Lehman Dr Unit A is a home located in Island County with nearby schools including Elger Bay Elementary School, Stanwood Middle School, and Stanwood High School.
Ownership History
Date
Name
Owned For
Owner Type
Purchase Details
Closed on
Sep 26, 2025
Sold by
Shellan Dean and Shellan Karen
Bought by
Heikke Jeffrey Michael
Current Estimated Value
Home Financials for this Owner
Home Financials are based on the most recent Mortgage that was taken out on this home.
Original Mortgage
$1,277,500
Outstanding Balance
$1,277,500
Interest Rate
6.58%
Mortgage Type
New Conventional
Estimated Equity
$453,511
Purchase Details
Closed on
Oct 14, 2015
Sold by
Anderson Steven G and Anderson Michelle M
Bought by
Shellan Dean and Shellan Karen
Home Financials for this Owner
Home Financials are based on the most recent Mortgage that was taken out on this home.
Original Mortgage
$240,000
Interest Rate
3.87%
Mortgage Type
Purchase Money Mortgage
Purchase Details
Closed on
Dec 22, 2003
Sold by
Donnan John and Donnan Margaret P
Bought by
Anderson Steven G and Anderson Michelle M
Create a Home Valuation Report for This Property
The Home Valuation Report is an in-depth analysis detailing your home's value as well as a comparison with similar homes in the area
Home Values in the Area
Average Home Value in this Area
Purchase History
| Date | Buyer | Sale Price | Title Company |
|---|---|---|---|
| Heikke Jeffrey Michael | $1,825,000 | None Listed On Document | |
| Shellan Dean | $689,000 | Chicago Title Company Of Wa | |
| Anderson Steven G | $128,000 | Chicago Title Co Island Div |
Source: Public Records
Mortgage History
| Date | Status | Borrower | Loan Amount |
|---|---|---|---|
| Open | Heikke Jeffrey Michael | $1,277,500 | |
| Previous Owner | Shellan Dean | $240,000 |
Source: Public Records
Tax History Compared to Growth
Tax History
| Year | Tax Paid | Tax Assessment Tax Assessment Total Assessment is a certain percentage of the fair market value that is determined by local assessors to be the total taxable value of land and additions on the property. | Land | Improvement |
|---|---|---|---|---|
| 2024 | $9,417 | $1,229,788 | $430,000 | $799,788 |
| 2023 | $9,417 | $1,236,896 | $430,000 | $806,896 |
| 2022 | $7,910 | $1,126,284 | $390,000 | $736,284 |
| 2021 | $7,765 | $859,146 | $260,000 | $599,146 |
| 2020 | $7,531 | $816,710 | $235,000 | $581,710 |
| 2019 | $7,094 | $782,367 | $275,000 | $507,367 |
| 2018 | $7,115 | $738,756 | $230,000 | $508,756 |
| 2017 | $6,448 | $686,536 | $175,000 | $511,536 |
| 2016 | $5,807 | $692,096 | $175,000 | $517,096 |
| 2015 | -- | $599,074 | $150,000 | $449,074 |
| 2013 | -- | $609,082 | $150,000 | $459,082 |
Source: Public Records
Map
Nearby Homes
- 169 Driftwood Shores Rd
- 501 S Vesper Way
- 446 Lehman Dr
- 289 E Driftwood Shores Rd
- 881 Lawson Rd
- 979 Cavalero Rd
- 1005 Cavalero Rd
- 230 Rocky Mountain High Rd
- 1095 Saint Moritz Ct
- 14 Zermatt Ct
- 1142 San Juan Dr
- 1140 Matterhorn Loop
- 1188 Central Dr
- 1215 S East Camano Dr
- 1235 View St
- 1237 SE Camano Dr
- 0 Noble Fir Ln Unit NWM2377874
- 945 Rowe Rd
- 244 David St
- 1273 SE Camano Dr