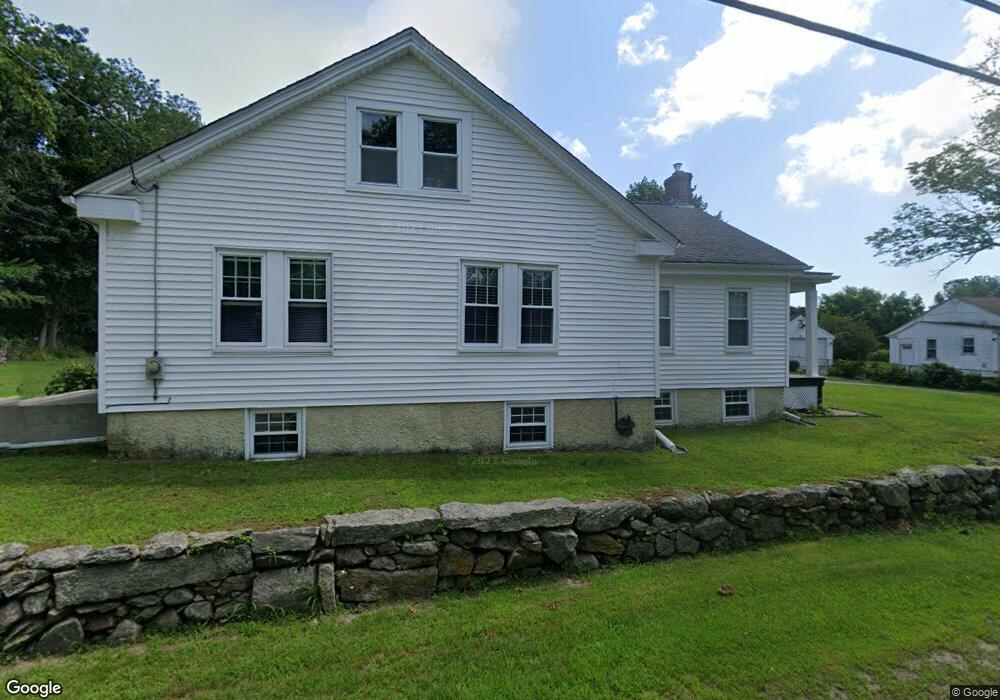
656 Main St Acushnet, MA 02743
Upper Acushnet NeighborhoodEstimated Value: $556,054 - $650,000
3
Beds
2
Baths
2,123
Sq Ft
$278/Sq Ft
Est. Value
About This Home
This home is located at 656 Main St, Acushnet, MA 02743 and is currently estimated at $590,014, approximately $277 per square foot. 656 Main St is a home located in Bristol County with nearby schools including Acushnet Elementary School, Albert F Ford Middle School, and Alma Del Mar Charter School.
Ownership History
Date
Name
Owned For
Owner Type
Purchase Details
Closed on
Sep 17, 2020
Sold by
Cardoza Manuel and Cardoza Laurie
Bought by
Cardoza Laurie and Cardoza Megan L
Current Estimated Value
Purchase Details
Closed on
Apr 25, 2006
Sold by
Booker Arleen M
Bought by
Cardoza Laurie and Cardoza Manuel
Home Financials for this Owner
Home Financials are based on the most recent Mortgage that was taken out on this home.
Original Mortgage
$150,000
Interest Rate
6.37%
Mortgage Type
Purchase Money Mortgage
Create a Home Valuation Report for This Property
The Home Valuation Report is an in-depth analysis detailing your home's value as well as a comparison with similar homes in the area
Home Values in the Area
Average Home Value in this Area
Purchase History
| Date | Buyer | Sale Price | Title Company |
|---|---|---|---|
| Cardoza Laurie | -- | None Available | |
| Cardoza Laurie | $295,000 | -- |
Source: Public Records
Mortgage History
| Date | Status | Borrower | Loan Amount |
|---|---|---|---|
| Previous Owner | Cardoza Laurie | $150,000 | |
| Previous Owner | Cardoza Laurie | $150,000 |
Source: Public Records
Tax History Compared to Growth
Tax History
| Year | Tax Paid | Tax Assessment Tax Assessment Total Assessment is a certain percentage of the fair market value that is determined by local assessors to be the total taxable value of land and additions on the property. | Land | Improvement |
|---|---|---|---|---|
| 2025 | $47 | $437,200 | $139,400 | $297,800 |
| 2024 | $4,677 | $409,900 | $132,100 | $277,800 |
| 2023 | $4,414 | $367,800 | $119,800 | $248,000 |
| 2022 | $4,508 | $339,700 | $112,500 | $227,200 |
| 2021 | $4,148 | $299,900 | $112,500 | $187,400 |
| 2020 | $4,079 | $292,600 | $105,200 | $187,400 |
| 2019 | $3,861 | $272,300 | $100,300 | $172,000 |
| 2018 | $5,611 | $259,300 | $100,300 | $159,000 |
| 2017 | $3,629 | $251,300 | $100,300 | $151,000 |
| 2016 | $3,455 | $237,800 | $100,300 | $137,500 |
| 2015 | $3,396 | $237,800 | $100,300 | $137,500 |
Source: Public Records
Map
Nearby Homes
- 0 Confidential Way Unit 73340085
- 363 Main St
- 16 Morses Ln
- 25 Pershing Ave
- 41 Chershire Ave
- 329 Middle Rd
- 1 Rounseville Rd
- 0 Hathaway Rd Unit 73469544
- 134 Nyes Ln
- 0 Keene Rd Unit 73459818
- 9 Monmouth St
- 76 Main St
- 14 Hayes St Unit 1
- 12 Hayes St Unit 1
- 224 North St
- ES Acushnet Ave
- 40 Foley Dr
- 7 Laura Ln
- 12 Pontiac St
- 1026 Shelburne St