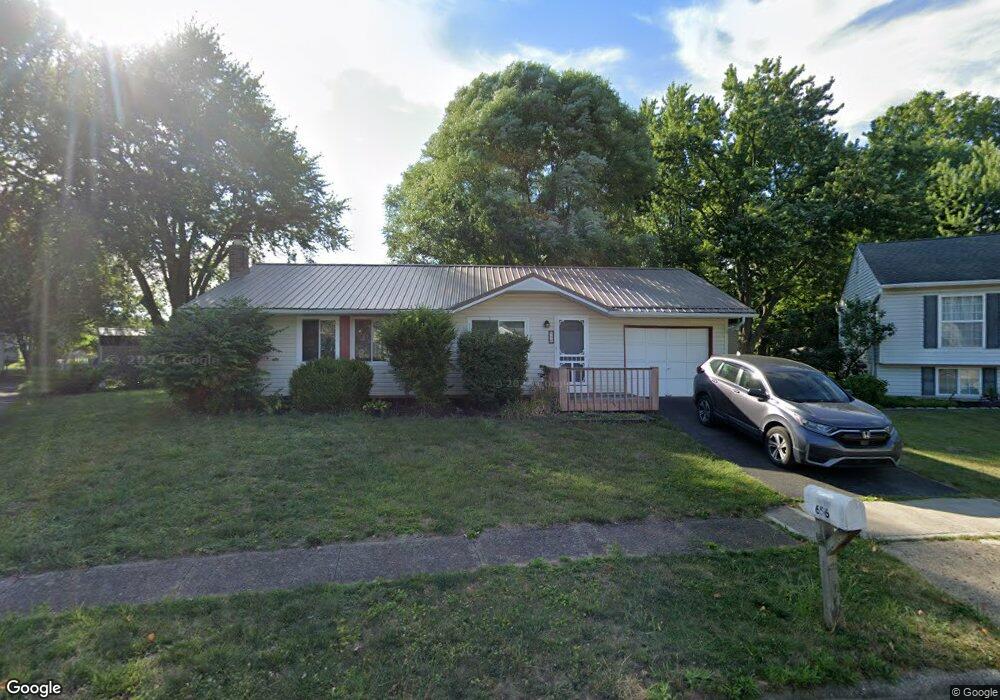
656 Mistletoe Ct Columbus, OH 43230
Woodside Green NeighborhoodEstimated Value: $255,294 - $290,000
3
Beds
1
Bath
988
Sq Ft
$278/Sq Ft
Est. Value
About This Home
This home is located at 656 Mistletoe Ct, Columbus, OH 43230 and is currently estimated at $275,074, approximately $278 per square foot. 656 Mistletoe Ct is a home located in Franklin County with nearby schools including Royal Manor Elementary School, Gahanna West Middle School, and Lincoln High School.
Ownership History
Date
Name
Owned For
Owner Type
Purchase Details
Closed on
Apr 28, 2014
Sold by
Mcdorman Rebecca M
Bought by
Dhrp Llc
Current Estimated Value
Home Financials for this Owner
Home Financials are based on the most recent Mortgage that was taken out on this home.
Original Mortgage
$69,675
Interest Rate
4.41%
Mortgage Type
Future Advance Clause Open End Mortgage
Purchase Details
Closed on
Mar 4, 2009
Sold by
Schirtzinger Rosemary
Bought by
Mcdorman Rebecca M
Purchase Details
Closed on
Dec 11, 1998
Sold by
Schirtzinger Rosemary
Bought by
Schirtzinger Rosemary
Purchase Details
Closed on
Mar 10, 1995
Sold by
Thorne Rebecca S
Bought by
Rosemary Schirtzinger
Home Financials for this Owner
Home Financials are based on the most recent Mortgage that was taken out on this home.
Original Mortgage
$59,900
Interest Rate
8.38%
Mortgage Type
New Conventional
Purchase Details
Closed on
Nov 1, 1985
Create a Home Valuation Report for This Property
The Home Valuation Report is an in-depth analysis detailing your home's value as well as a comparison with similar homes in the area
Home Values in the Area
Average Home Value in this Area
Purchase History
| Date | Buyer | Sale Price | Title Company |
|---|---|---|---|
| Dhrp Llc | $53,000 | Valmer Land Title Agency Box | |
| Mcdorman Rebecca M | -- | Attorney | |
| Schirtzinger Rosemary | -- | -- | |
| Rosemary Schirtzinger | $79,900 | -- | |
| -- | -- | -- |
Source: Public Records
Mortgage History
| Date | Status | Borrower | Loan Amount |
|---|---|---|---|
| Closed | Dhrp Llc | $69,675 | |
| Previous Owner | Rosemary Schirtzinger | $59,900 |
Source: Public Records
Tax History
| Year | Tax Paid | Tax Assessment Tax Assessment Total Assessment is a certain percentage of the fair market value that is determined by local assessors to be the total taxable value of land and additions on the property. | Land | Improvement |
|---|---|---|---|---|
| 2025 | $4,475 | $74,450 | $24,050 | $50,400 |
| 2024 | $4,475 | $74,450 | $24,050 | $50,400 |
| 2023 | $4,419 | $74,450 | $24,050 | $50,400 |
| 2022 | $3,542 | $46,480 | $12,320 | $34,160 |
| 2021 | $3,428 | $46,480 | $12,320 | $34,160 |
| 2020 | $3,401 | $46,480 | $12,320 | $34,160 |
| 2019 | $2,956 | $40,180 | $10,290 | $29,890 |
| 2018 | $2,705 | $40,180 | $10,290 | $29,890 |
| 2017 | $2,596 | $40,180 | $10,290 | $29,890 |
| 2016 | $2,472 | $33,260 | $10,960 | $22,300 |
| 2015 | $2,474 | $33,260 | $10,960 | $22,300 |
| 2014 | $1,760 | $33,260 | $10,960 | $22,300 |
| 2013 | $947 | $35,280 | $10,955 | $24,325 |
Source: Public Records
Map
Nearby Homes
- 3877 Hines Rd
- 536 Springwood Lake Dr
- 830 Lindenhaven Rd
- 613 Mistletoe St
- 3455 Halpern St
- 3555 Tami Place
- 4672 Sperry Ave
- 956 Crystal Cay Ct
- 0 Wendler Blvd
- 475 Denwood Ct
- 586 Pinegrove Place
- 427 Canfield Dr
- 424 Lincolnshire Rd
- 3715 Montclair Dr
- 394 Banbury Dr
- 420 Denwood Ct
- 4125 Emerius Dr
- 595 Deerwood Ave E
- 395 Amesbury Dr
- 439 Canterwood Ct
- 676 Mistletoe Ct
- 811 Mistletoe Ct
- 805 Mistletoe Ct
- 820 Hines Rd
- 644 Mistletoe Ct
- 641 Mistletoe Ct
- 812 Hines Rd
- 806 Mistletoe Ct
- 638 Mistletoe Ct
- 662 Thistle Ave
- 806 Hines Rd
- 635 Mistletoe Ct
- 831 Quitman Dr W
- 826 Hines Rd
- 650 Thistle Ave
- 632 Mistletoe Ct
- 668 Thistle Ave
- 823 Quitman Dr W
- 629 Mistletoe Ct
- 644 Thistle Ave
Your Personal Tour Guide
Ask me questions while you tour the home.