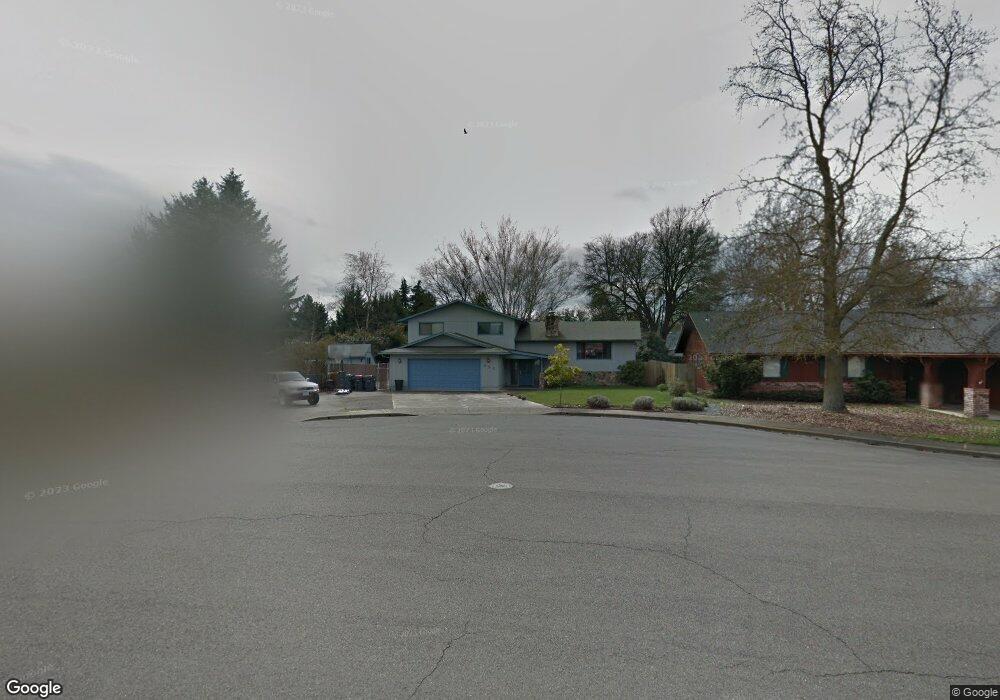
656 Rose Valley Ct Central Point, OR 97502
Estimated Value: $497,319 - $539,000
3
Beds
2
Baths
2,500
Sq Ft
$204/Sq Ft
Est. Value
About This Home
This home is located at 656 Rose Valley Ct, Central Point, OR 97502 and is currently estimated at $511,080, approximately $204 per square foot. 656 Rose Valley Ct is a home located in Jackson County with nearby schools including Central Point Elementary School, Scenic Middle School, and Crater High School.
Ownership History
Date
Name
Owned For
Owner Type
Purchase Details
Closed on
Dec 27, 2007
Sold by
Hamre Stephen C and Hamre Kimberly Ann
Bought by
Hamre Kimberly Ann
Current Estimated Value
Home Financials for this Owner
Home Financials are based on the most recent Mortgage that was taken out on this home.
Original Mortgage
$258,750
Outstanding Balance
$160,774
Interest Rate
6.21%
Mortgage Type
Purchase Money Mortgage
Estimated Equity
$350,306
Purchase Details
Closed on
May 24, 2004
Sold by
Kessler Homer K and Kessler Velda L Guthrie
Bought by
Hamre Stephen C and Hamre Kimberly Ann
Home Financials for this Owner
Home Financials are based on the most recent Mortgage that was taken out on this home.
Original Mortgage
$180,000
Interest Rate
5.86%
Mortgage Type
Purchase Money Mortgage
Purchase Details
Closed on
Dec 9, 1997
Sold by
Stotler Raymond S and Stotler Donna M
Bought by
Kessler Homer K and Kessler Velda L Guthrie
Create a Home Valuation Report for This Property
The Home Valuation Report is an in-depth analysis detailing your home's value as well as a comparison with similar homes in the area
Purchase History
| Date | Buyer | Sale Price | Title Company |
|---|---|---|---|
| Hamre Kimberly Ann | $42,500 | None Available | |
| Hamre Stephen C | $262,000 | Lawyers Title Ins | |
| Kessler Homer K | $145,000 | Jackson County Title |
Source: Public Records
Mortgage History
| Date | Status | Borrower | Loan Amount |
|---|---|---|---|
| Open | Hamre Kimberly Ann | $258,750 | |
| Closed | Hamre Stephen C | $180,000 |
Source: Public Records
Tax History
| Year | Tax Paid | Tax Assessment Tax Assessment Total Assessment is a certain percentage of the fair market value that is determined by local assessors to be the total taxable value of land and additions on the property. | Land | Improvement |
|---|---|---|---|---|
| 2026 | $5,106 | $308,570 | -- | -- |
| 2025 | $4,981 | $299,590 | $99,290 | $200,300 |
| 2024 | $4,981 | $290,870 | $96,390 | $194,480 |
| 2023 | $4,821 | $282,400 | $93,590 | $188,810 |
| 2022 | $4,708 | $282,400 | $93,590 | $188,810 |
| 2021 | $4,574 | $274,180 | $90,870 | $183,310 |
| 2020 | $4,440 | $266,200 | $88,220 | $177,980 |
| 2019 | $4,331 | $250,930 | $83,150 | $167,780 |
| 2018 | $4,199 | $243,630 | $80,730 | $162,900 |
| 2017 | $4,093 | $243,630 | $80,730 | $162,900 |
| 2016 | $3,974 | $229,660 | $76,100 | $153,560 |
| 2015 | $3,808 | $229,660 | $76,100 | $153,560 |
| 2014 | $3,711 | $216,490 | $71,720 | $144,770 |
Source: Public Records
Map
Nearby Homes
- 736 Hemlock Ave
- 3364 Bursell Rd
- 755 S 4th St
- 3358 Bursell Rd
- 1204 Heather Ln
- 887 Silver Fox Dr
- 555 Freeman Rd Unit 73
- 555 Freeman Rd Unit 254
- 555 Freeman Rd Unit 105
- 555 Freeman Rd Unit 209
- 827 Isherwood Dr
- 959 Westrop Dr
- 533 Brittni Ln
- 918 Brandi Way
- 1189 Lindsey Ct
- 1258 Joshua Ct
- 114 Cedar St
- 301 Freeman Rd Unit 30
- 301 Freeman Rd Unit 92
- 301 Freeman Rd Unit 91
- 644 Rose Valley Ct
- 668 Rose Valley Ct
- 611 Edwina Ave
- 609 Edwina Ave
- 632 Rose Valley Ct
- 667 Rose Valley Ct
- 607 Edwina Ave
- 3498 Edella St
- 1005 Edwina Ave
- 3500 Edella St
- 3495 Edella St
- 643 Rose Valley Ct
- 655 Rose Valley Ct
- 616 Rose Valley Ct
- 928 Pittview Ct
- 635 Rose Valley Ct
- 605 Edwina Ave
- 3477 Edella St
- 924 Pittview Ct
- 608 Rose Valley Ct
Your Personal Tour Guide
Ask me questions while you tour the home.