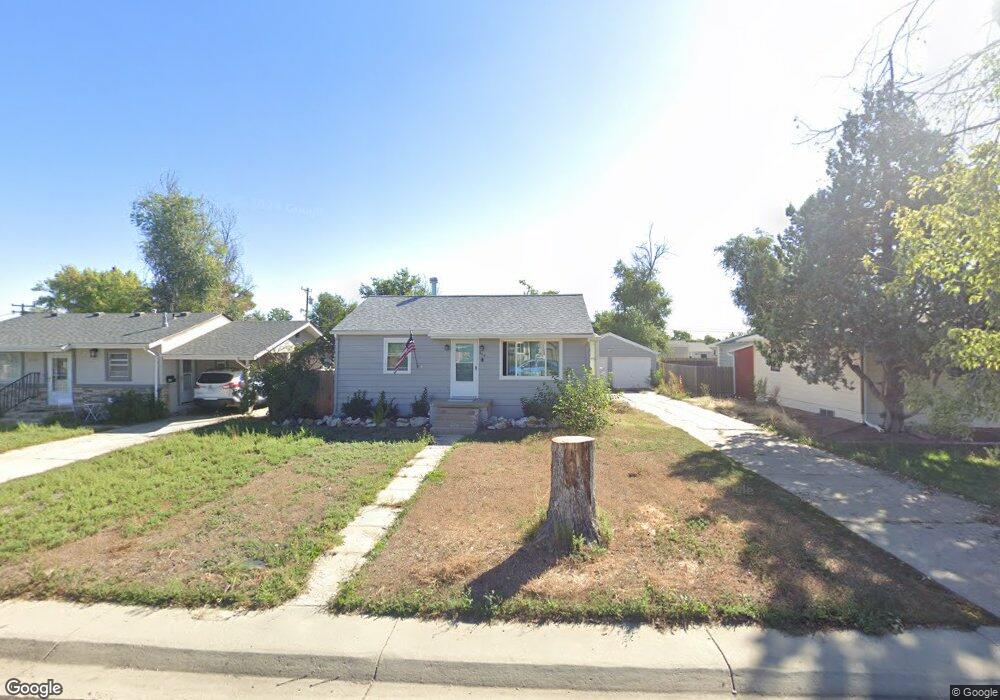
656 S 2nd Ave Brighton, CO 80601
Estimated Value: $349,000 - $394,995
4
Beds
2
Baths
1,365
Sq Ft
$278/Sq Ft
Est. Value
About This Home
This home is located at 656 S 2nd Ave, Brighton, CO 80601 and is currently estimated at $379,999, approximately $278 per square foot. 656 S 2nd Ave is a home located in Adams County with nearby schools including South Elementary School, Vikan Middle School, and Brighton High School.
Ownership History
Date
Name
Owned For
Owner Type
Purchase Details
Closed on
Mar 22, 2021
Sold by
Andrews Blake C
Bought by
Griffin Tad and Thepphotha Vithada
Current Estimated Value
Home Financials for this Owner
Home Financials are based on the most recent Mortgage that was taken out on this home.
Original Mortgage
$323,040
Outstanding Balance
$289,730
Interest Rate
2.73%
Mortgage Type
FHA
Estimated Equity
$90,270
Purchase Details
Closed on
Mar 8, 2018
Sold by
Andrews Blake C and Andrews Russell W
Bought by
Andrews Blake C
Purchase Details
Closed on
Sep 26, 2007
Sold by
Jonathan F & Rose E Koosmann Family Trus
Bought by
Andrews Blake C and Andrews Russell W
Home Financials for this Owner
Home Financials are based on the most recent Mortgage that was taken out on this home.
Original Mortgage
$132,442
Interest Rate
6.66%
Mortgage Type
FHA
Purchase Details
Closed on
Feb 17, 1998
Sold by
Koosmann Jonathan F
Bought by
Jonathan F & Rose E Koosmann Family Tr
Create a Home Valuation Report for This Property
The Home Valuation Report is an in-depth analysis detailing your home's value as well as a comparison with similar homes in the area
Home Values in the Area
Average Home Value in this Area
Purchase History
| Date | Buyer | Sale Price | Title Company |
|---|---|---|---|
| Griffin Tad | $334,000 | Heritage Title Co | |
| Andrews Blake C | -- | None Available | |
| Andrews Blake C | $145,000 | Security Title | |
| Jonathan F & Rose E Koosmann Family Tr | -- | -- |
Source: Public Records
Mortgage History
| Date | Status | Borrower | Loan Amount |
|---|---|---|---|
| Open | Griffin Tad | $323,040 | |
| Previous Owner | Andrews Blake C | $132,442 |
Source: Public Records
Tax History Compared to Growth
Tax History
| Year | Tax Paid | Tax Assessment Tax Assessment Total Assessment is a certain percentage of the fair market value that is determined by local assessors to be the total taxable value of land and additions on the property. | Land | Improvement |
|---|---|---|---|---|
| 2024 | $2,559 | $24,070 | $5,630 | $18,440 |
| 2023 | $2,547 | $26,860 | $6,090 | $20,770 |
| 2022 | $2,205 | $21,410 | $5,280 | $16,130 |
| 2021 | $2,205 | $21,410 | $5,280 | $16,130 |
| 2020 | $1,978 | $20,030 | $4,720 | $15,310 |
| 2019 | $1,980 | $20,030 | $4,720 | $15,310 |
| 2018 | $1,455 | $14,710 | $5,400 | $9,310 |
| 2017 | $1,453 | $14,710 | $5,400 | $9,310 |
| 2016 | $1,105 | $11,150 | $2,630 | $8,520 |
| 2015 | $1,103 | $11,150 | $2,630 | $8,520 |
| 2014 | $1,014 | $10,400 | $2,070 | $8,330 |
Source: Public Records
Map
Nearby Homes