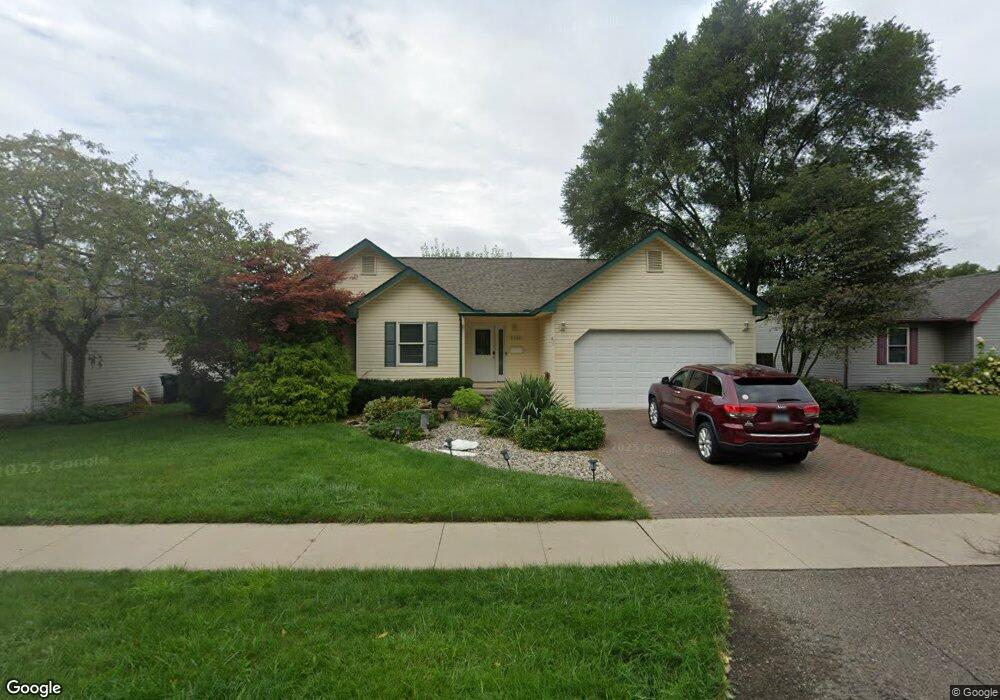
6560 Elm St Taylor, MI 48180
Estimated Value: $183,000 - $243,000
3
Beds
2
Baths
1,757
Sq Ft
$128/Sq Ft
Est. Value
About This Home
This home is located at 6560 Elm St, Taylor, MI 48180 and is currently estimated at $224,492, approximately $127 per square foot. 6560 Elm St is a home located in Wayne County with nearby schools including Clarence Randall Elementary School, Hoover Middle School, and Quest Charter Academy.
Ownership History
Date
Name
Owned For
Owner Type
Purchase Details
Closed on
Sep 30, 2019
Sold by
Moser Pamela L and Delcavo Timothy
Bought by
Johnson Katrina
Current Estimated Value
Purchase Details
Closed on
Feb 26, 2014
Sold by
Delcavo Anthony J and Moser Pamela L
Bought by
Delcavo Timothy and Moser Pamela L
Purchase Details
Closed on
Mar 22, 2013
Sold by
Moser Pamela
Bought by
Delcavo Anthony J and Moser Pamela L
Home Financials for this Owner
Home Financials are based on the most recent Mortgage that was taken out on this home.
Original Mortgage
$87,250
Interest Rate
3.48%
Mortgage Type
New Conventional
Purchase Details
Closed on
May 21, 2008
Sold by
Lewandowski Cynthia and Guelff Cynthia
Bought by
Moser Pamela
Purchase Details
Closed on
Aug 24, 2005
Sold by
Guelff Kristopher and Guelff Cynthia
Bought by
Lewandowski Cynthia
Purchase Details
Closed on
Feb 26, 2004
Sold by
School Board District Of Taylor Township
Bought by
Guelff Kristopher
Create a Home Valuation Report for This Property
The Home Valuation Report is an in-depth analysis detailing your home's value as well as a comparison with similar homes in the area
Home Values in the Area
Average Home Value in this Area
Purchase History
| Date | Buyer | Sale Price | Title Company |
|---|---|---|---|
| Johnson Katrina | $166,000 | Embassy Title Agency Inc | |
| Delcavo Timothy | -- | None Available | |
| Delcavo Anthony J | -- | Title Source Inc | |
| Moser Pamela | $120,000 | Michigan Title Insurance Age | |
| Lewandowski Cynthia | -- | None Available | |
| Guelff Kristopher | $159,900 | Minnesota Title Agency |
Source: Public Records
Mortgage History
| Date | Status | Borrower | Loan Amount |
|---|---|---|---|
| Previous Owner | Delcavo Anthony J | $87,250 |
Source: Public Records
Tax History Compared to Growth
Tax History
| Year | Tax Paid | Tax Assessment Tax Assessment Total Assessment is a certain percentage of the fair market value that is determined by local assessors to be the total taxable value of land and additions on the property. | Land | Improvement |
|---|---|---|---|---|
| 2025 | $3,392 | $111,700 | $0 | $0 |
| 2024 | $3,392 | $99,500 | $0 | $0 |
| 2023 | $4,044 | $89,100 | $0 | $0 |
| 2022 | $3,237 | $81,400 | $0 | $0 |
| 2021 | $3,558 | $74,300 | $0 | $0 |
| 2020 | $3,522 | $67,700 | $0 | $0 |
| 2019 | $288,765 | $55,200 | $0 | $0 |
| 2018 | $2,408 | $41,700 | $0 | $0 |
| 2017 | $938 | $42,100 | $0 | $0 |
| 2016 | $2,799 | $40,900 | $0 | $0 |
| 2015 | $3,820 | $38,200 | $0 | $0 |
| 2013 | $4,000 | $40,000 | $0 | $0 |
| 2012 | $2,513 | $39,200 | $12,400 | $26,800 |
Source: Public Records
Map
Nearby Homes