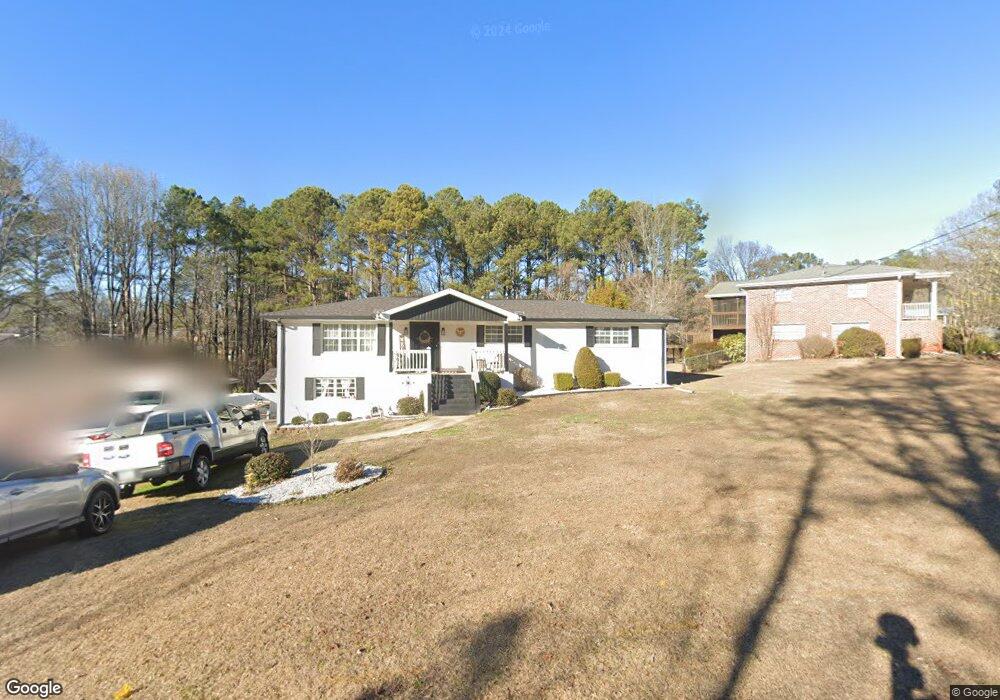
6563 Willow Ln Winston, GA 30187
Bill Arp NeighborhoodEstimated Value: $216,532 - $246,000
3
Beds
2
Baths
1,425
Sq Ft
$162/Sq Ft
Est. Value
About This Home
This home is located at 6563 Willow Ln, Winston, GA 30187 and is currently estimated at $230,383, approximately $161 per square foot. 6563 Willow Ln is a home located in Douglas County with nearby schools including Bright Star Elementary School, Mason Creek Middle School, and Alexander High School.
Ownership History
Date
Name
Owned For
Owner Type
Purchase Details
Closed on
Oct 23, 2002
Sold by
Allison Christopher
Bought by
Starboard Props Llc
Current Estimated Value
Purchase Details
Closed on
Dec 4, 2001
Sold by
Treece Scott
Bought by
Allison Christopher
Purchase Details
Closed on
Jun 14, 1999
Sold by
Dept Of Va Affairs
Bought by
Treece Scott
Home Financials for this Owner
Home Financials are based on the most recent Mortgage that was taken out on this home.
Original Mortgage
$75,100
Interest Rate
7.66%
Mortgage Type
VA
Purchase Details
Closed on
Aug 4, 1998
Sold by
Bok Mtg
Bought by
Va
Purchase Details
Closed on
Feb 25, 1993
Sold by
Parker Peggy H
Bought by
Brown Frank S and Brown Allyson
Home Financials for this Owner
Home Financials are based on the most recent Mortgage that was taken out on this home.
Original Mortgage
$65,970
Interest Rate
8%
Mortgage Type
VA
Create a Home Valuation Report for This Property
The Home Valuation Report is an in-depth analysis detailing your home's value as well as a comparison with similar homes in the area
Home Values in the Area
Average Home Value in this Area
Purchase History
| Date | Buyer | Sale Price | Title Company |
|---|---|---|---|
| Starboard Props Llc | -- | -- | |
| Allison Christopher | $82,500 | -- | |
| Treece Scott | $75,000 | -- | |
| Va | -- | -- | |
| Bok Mtg | $68,500 | -- | |
| Brown Frank S | $65,200 | -- |
Source: Public Records
Mortgage History
| Date | Status | Borrower | Loan Amount |
|---|---|---|---|
| Previous Owner | Treece Scott | $75,100 | |
| Previous Owner | Brown Frank S | $65,970 |
Source: Public Records
Tax History Compared to Growth
Tax History
| Year | Tax Paid | Tax Assessment Tax Assessment Total Assessment is a certain percentage of the fair market value that is determined by local assessors to be the total taxable value of land and additions on the property. | Land | Improvement |
|---|---|---|---|---|
| 2024 | $1,761 | $55,960 | $8,600 | $47,360 |
| 2023 | $1,761 | $55,960 | $8,600 | $47,360 |
| 2022 | $1,822 | $55,960 | $8,600 | $47,360 |
| 2021 | $1,466 | $44,960 | $8,400 | $36,560 |
| 2020 | $1,491 | $44,960 | $8,400 | $36,560 |
| 2019 | $1,287 | $41,560 | $8,400 | $33,160 |
| 2018 | $1,251 | $40,200 | $8,400 | $31,800 |
| 2017 | $1,156 | $36,440 | $8,400 | $28,040 |
| 2016 | $876 | $30,480 | $7,280 | $23,200 |
| 2015 | $1,036 | $35,040 | $8,600 | $26,440 |
| 2014 | $1,000 | $33,120 | $8,600 | $24,520 |
| 2013 | -- | $32,680 | $8,600 | $24,080 |
Source: Public Records
Map
Nearby Homes
- 6556 Willow Ln
- 6512 Executive Dr
- 6480 Executive Dr
- 6662 Birchwood Ct
- 3301 Connie Way
- 6431 Courtney Dr
- 6776 Birch Rd
- 3575 Bright Star Rd
- 3677 Bright Star Rd
- 3422 Bright Star Rd
- 6549 Biscayne Way
- 3756 Bright Star Rd
- 0 Cowan Ridge Dr Unit 10225526
- 3829 Bright Star Rd
- 20 Roper Dr
- 3850 Bright Star Rd
- 6653 Prinston Cir
- 3741 100 Rd
- 6226 Pine Ln
- 6274 Pine Frost Dr
- 6573 Willow Ln
- 6635 Courtney Dr
- 0 Courtney Dr Unit 7230102
- 0 Courtney Dr Unit 7058599
- 0 Courtney Dr Unit 8557319
- 0 Courtney Dr Unit 8102479
- 0 Courtney Dr Unit 8220892
- 0 Courtney Dr Unit 8703973
- 0 Courtney Dr Unit 8670701
- 0 Courtney Dr Unit 3108435
- 6598 Willow Ln
- 3442 Rainbow Dr Unit 1
- 6589 Willow Ln
- 0 Willow Ln Unit 7630118
- 0 Willow Ln Unit 7544682
- 0 Willow Ln Unit 7390719
- 0 Willow Ln Unit 7171351
- 6661 Courtney Dr
- 6640 Courtney Dr
- 3430 Rainbow Dr