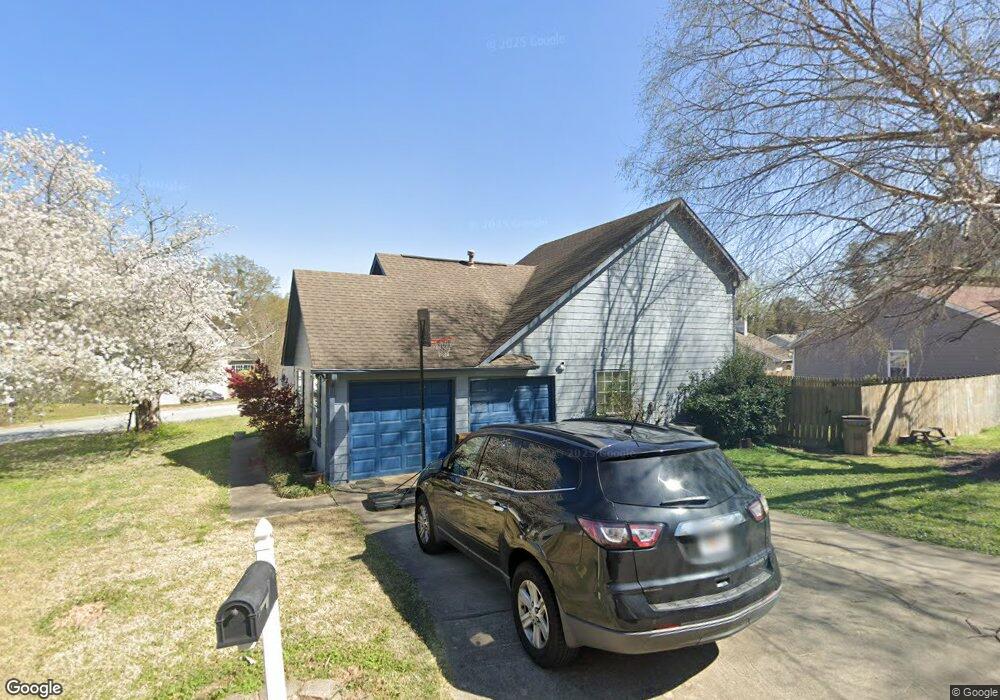
6564 Planters Ct Unit 1 Morrow, GA 30260
Estimated Value: $229,942 - $297,000
3
Beds
2
Baths
1,794
Sq Ft
$143/Sq Ft
Est. Value
About This Home
This home is located at 6564 Planters Ct Unit 1, Morrow, GA 30260 and is currently estimated at $256,986, approximately $143 per square foot. 6564 Planters Ct Unit 1 is a home located in Clayton County with nearby schools including William M. Mcgarrah Elementary School, Rex Mill Middle School, and Mount Zion High School.
Ownership History
Date
Name
Owned For
Owner Type
Purchase Details
Closed on
Sep 4, 2003
Sold by
Hayes Timothy
Bought by
Hayes Charis
Current Estimated Value
Home Financials for this Owner
Home Financials are based on the most recent Mortgage that was taken out on this home.
Original Mortgage
$116,369
Outstanding Balance
$53,002
Interest Rate
6.33%
Mortgage Type
FHA
Estimated Equity
$203,984
Purchase Details
Closed on
Aug 1, 2001
Sold by
Steverson Aried C and Steverson Chasity
Bought by
Hayes Timothy
Home Financials for this Owner
Home Financials are based on the most recent Mortgage that was taken out on this home.
Original Mortgage
$112,253
Interest Rate
7.1%
Mortgage Type
FHA
Purchase Details
Closed on
Nov 4, 1997
Sold by
Radonski Daniel R and Radonski Melonee L
Bought by
Steverson Ariek C and Phillips Chasity A
Home Financials for this Owner
Home Financials are based on the most recent Mortgage that was taken out on this home.
Original Mortgage
$91,950
Interest Rate
7.31%
Mortgage Type
VA
Create a Home Valuation Report for This Property
The Home Valuation Report is an in-depth analysis detailing your home's value as well as a comparison with similar homes in the area
Home Values in the Area
Average Home Value in this Area
Purchase History
| Date | Buyer | Sale Price | Title Company |
|---|---|---|---|
| Hayes Charis | -- | -- | |
| Hayes Timothy | $113,500 | -- | |
| Steverson Ariek C | $89,500 | -- |
Source: Public Records
Mortgage History
| Date | Status | Borrower | Loan Amount |
|---|---|---|---|
| Open | Hayes Charis | $116,369 | |
| Previous Owner | Hayes Timothy | $112,253 | |
| Previous Owner | Steverson Ariek C | $91,950 |
Source: Public Records
Tax History
| Year | Tax Paid | Tax Assessment Tax Assessment Total Assessment is a certain percentage of the fair market value that is determined by local assessors to be the total taxable value of land and additions on the property. | Land | Improvement |
|---|---|---|---|---|
| 2025 | $3,119 | $90,440 | $8,000 | $82,440 |
| 2024 | $2,926 | $84,040 | $8,000 | $76,040 |
| 2023 | $2,587 | $71,640 | $8,000 | $63,640 |
| 2022 | $2,360 | $69,160 | $8,000 | $61,160 |
| 2021 | $1,777 | $54,040 | $8,000 | $46,040 |
| 2020 | $1,718 | $52,014 | $8,000 | $44,014 |
| 2019 | $1,592 | $48,277 | $6,400 | $41,877 |
| 2018 | $1,411 | $43,822 | $6,400 | $37,422 |
| 2017 | $947 | $32,330 | $6,400 | $25,930 |
| 2016 | $752 | $27,557 | $6,400 | $21,157 |
| 2015 | $751 | $0 | $0 | $0 |
| 2014 | $777 | $28,548 | $6,400 | $22,148 |
Source: Public Records
Map
Nearby Homes
- 2783 Mill Lake Way
- 2845 Heritage Ln
- 2613 Stratford Ln Unit 3
- 6584 Sleepy Hollow Ln
- 2575 Stratford Ln
- 2617 Terrace Pkwy
- 2571 Stratford Ln Unit 2LH
- 6397 E Meyer Dr
- 2705 Heritage Ln
- 6486 Aquila Dr
- 6380 Mount Zion Blvd
- 6493 Menlo Way Unit 3
- 6852 Silver Maple Dr
- 6485 Bobolink Ct
- 6848 Silver Maple Dr
- 6844 Silver Maple Dr
- 6560 Maddox Rd
- 2497 Celina Ct
- 2509 Bonita Ct
- 3003 Menlo Park Dr
- 6570 Planters Ct Unit 1
- 6573 Oak Mill Ct Unit 1
- 6561 Planters Ct
- 6556 Oak Mill Ct
- 6555 Planters Ct
- 6567 Planters Ct
- 6562 Oak Mill Ct
- 6576 Planters Ct Unit 1
- 6568 Oak Mill Ct Unit 1
- 6568 Oak Mill Ct
- 6549 Oak Mill Ct
- 6550 Oak Mill Ct
- 6571 Planters Ct
- 6579 Oak Mill Ct
- 6574 Oak Mill Ct
- 6543 Oak Mill Ct
- 6580 Planters Ct
- 6580 Oak Mill Ct
- 6577 Planters Ct Unit 1
- 6538 Oak Mill Ct Unit 1
Your Personal Tour Guide
Ask me questions while you tour the home.