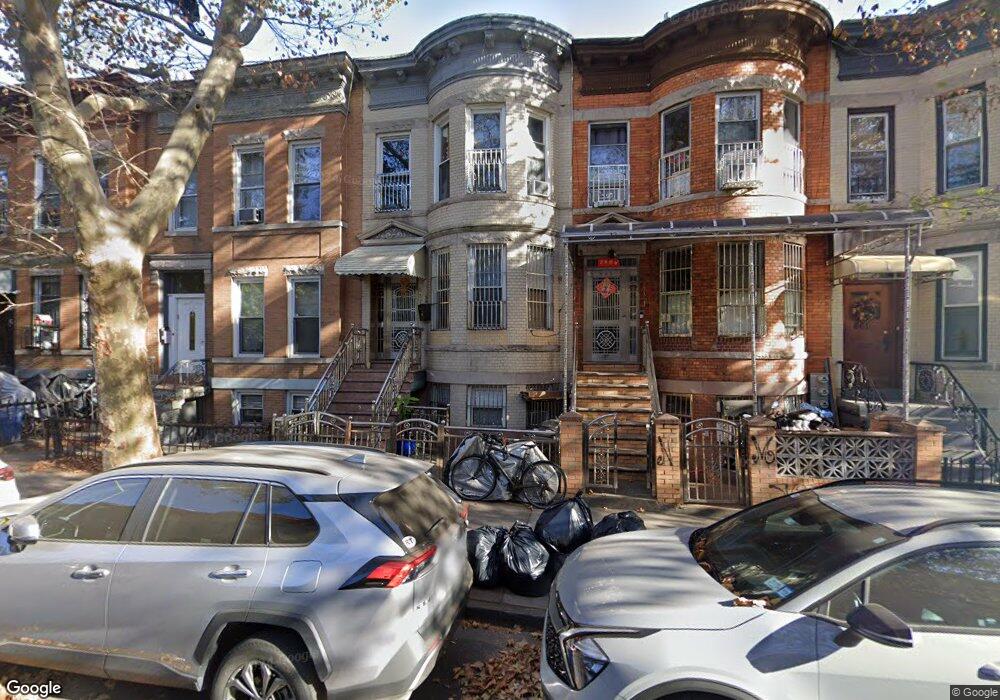
657 49th St Brooklyn, NY 11220
Sunset Park NeighborhoodEstimated Value: $1,354,168 - $1,636,000
Studio
--
Bath
1,776
Sq Ft
$845/Sq Ft
Est. Value
About This Home
This home is located at 657 49th St, Brooklyn, NY 11220 and is currently estimated at $1,500,542, approximately $844 per square foot. 657 49th St is a home located in Kings County with nearby schools including P.S. 94 The Henry Longfellow School, IS 220 John J. Pershing, and Leep Dual Language Academy Charter School.
Ownership History
Date
Name
Owned For
Owner Type
Purchase Details
Closed on
Feb 12, 2019
Sold by
Xie Jing Song and Zheng Jin Lan
Bought by
Ouyang Xiulan and Ouyang Xiumei
Current Estimated Value
Home Financials for this Owner
Home Financials are based on the most recent Mortgage that was taken out on this home.
Original Mortgage
$780,000
Outstanding Balance
$685,760
Interest Rate
4.5%
Mortgage Type
Purchase Money Mortgage
Estimated Equity
$814,782
Purchase Details
Closed on
Jan 19, 2011
Sold by
Makariw Edith and Tabler David L
Bought by
Xie Jing Song and Zheng Jin Lan
Home Financials for this Owner
Home Financials are based on the most recent Mortgage that was taken out on this home.
Original Mortgage
$450,000
Interest Rate
4.82%
Mortgage Type
Purchase Money Mortgage
Create a Home Valuation Report for This Property
The Home Valuation Report is an in-depth analysis detailing your home's value as well as a comparison with similar homes in the area
Home Values in the Area
Average Home Value in this Area
Purchase History
| Date | Buyer | Sale Price | Title Company |
|---|---|---|---|
| Ouyang Xiulan | $1,300,000 | -- | |
| Xie Jing Song | $751,000 | -- |
Source: Public Records
Mortgage History
| Date | Status | Borrower | Loan Amount |
|---|---|---|---|
| Open | Ouyang Xiulan | $780,000 | |
| Previous Owner | Xie Jing Song | $450,000 |
Source: Public Records
Tax History
| Year | Tax Paid | Tax Assessment Tax Assessment Total Assessment is a certain percentage of the fair market value that is determined by local assessors to be the total taxable value of land and additions on the property. | Land | Improvement |
|---|---|---|---|---|
| 2025 | $7,340 | $90,060 | $29,580 | $60,480 |
| 2024 | $7,340 | $71,940 | $29,580 | $42,360 |
| 2023 | $7,340 | $88,260 | $29,580 | $58,680 |
| 2022 | $6,870 | $81,780 | $29,580 | $52,200 |
| 2021 | $7,199 | $76,500 | $29,580 | $46,920 |
| 2020 | $3,376 | $69,420 | $29,580 | $39,840 |
| 2019 | $6,371 | $61,200 | $29,580 | $31,620 |
| 2018 | $6,208 | $30,456 | $13,967 | $16,489 |
| 2017 | $6,159 | $30,214 | $11,556 | $18,658 |
| 2016 | $5,699 | $28,507 | $13,061 | $15,446 |
| 2015 | $3,218 | $26,896 | $15,498 | $11,398 |
| 2014 | $3,218 | $25,380 | $16,577 | $8,803 |
Source: Public Records
Map
Nearby Homes
Your Personal Tour Guide
Ask me questions while you tour the home.