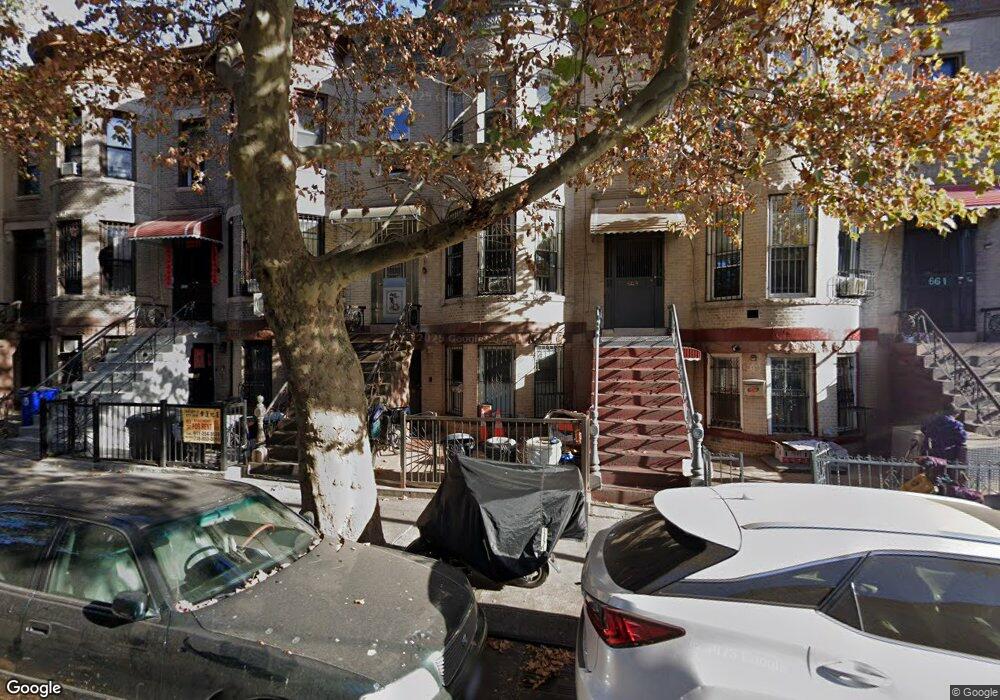
657 52nd St Brooklyn, NY 11220
Sunset Park NeighborhoodEstimated Value: $1,347,291 - $1,647,000
--
Bed
--
Bath
2,768
Sq Ft
$542/Sq Ft
Est. Value
About This Home
This home is located at 657 52nd St, Brooklyn, NY 11220 and is currently estimated at $1,499,323, approximately $541 per square foot. 657 52nd St is a home located in Kings County with nearby schools including P.S. 94 The Henry Longfellow School, IS 220 John J. Pershing, and Leep Dual Language Academy Charter School.
Ownership History
Date
Name
Owned For
Owner Type
Purchase Details
Closed on
Aug 29, 2019
Sold by
Chan Sze Yam and Chen Lizhen
Bought by
Chen Lizhen and Zhao Fu Kun
Current Estimated Value
Purchase Details
Closed on
Oct 19, 2007
Sold by
Chan Sze Yam
Bought by
Chan Sze Yam and Chen Lizhen
Purchase Details
Closed on
Apr 11, 2006
Sold by
Coons Mary
Bought by
Chan Sze Yam
Home Financials for this Owner
Home Financials are based on the most recent Mortgage that was taken out on this home.
Original Mortgage
$450,000
Interest Rate
6.4%
Mortgage Type
Purchase Money Mortgage
Purchase Details
Closed on
Apr 8, 2002
Sold by
Kelly Margaret M
Bought by
Gabriel Patricia and Roth Katherine
Create a Home Valuation Report for This Property
The Home Valuation Report is an in-depth analysis detailing your home's value as well as a comparison with similar homes in the area
Home Values in the Area
Average Home Value in this Area
Purchase History
| Date | Buyer | Sale Price | Title Company |
|---|---|---|---|
| Chen Lizhen | -- | -- | |
| Chan Sze Yam | -- | -- | |
| Chan Sze Yam | $685,000 | -- | |
| Gabriel Patricia | -- | -- |
Source: Public Records
Mortgage History
| Date | Status | Borrower | Loan Amount |
|---|---|---|---|
| Previous Owner | Chan Sze Yam | $450,000 |
Source: Public Records
Tax History Compared to Growth
Tax History
| Year | Tax Paid | Tax Assessment Tax Assessment Total Assessment is a certain percentage of the fair market value that is determined by local assessors to be the total taxable value of land and additions on the property. | Land | Improvement |
|---|---|---|---|---|
| 2025 | $11,520 | $92,460 | $30,300 | $62,160 |
| 2024 | $11,520 | $80,460 | $30,300 | $50,160 |
| 2023 | $10,990 | $82,980 | $30,300 | $52,680 |
| 2022 | $10,191 | $77,400 | $30,300 | $47,100 |
| 2021 | $10,135 | $73,680 | $30,300 | $43,380 |
| 2020 | $5,038 | $79,260 | $30,300 | $48,960 |
| 2019 | $9,999 | $63,000 | $30,300 | $32,700 |
| 2018 | $9,192 | $45,093 | $16,695 | $28,398 |
| 2017 | $8,672 | $42,541 | $15,367 | $27,174 |
| 2016 | $8,023 | $40,134 | $16,398 | $23,736 |
| 2015 | $4,621 | $40,134 | $21,161 | $18,973 |
| 2014 | $4,621 | $39,832 | $24,184 | $15,648 |
Source: Public Records
Map
Nearby Homes