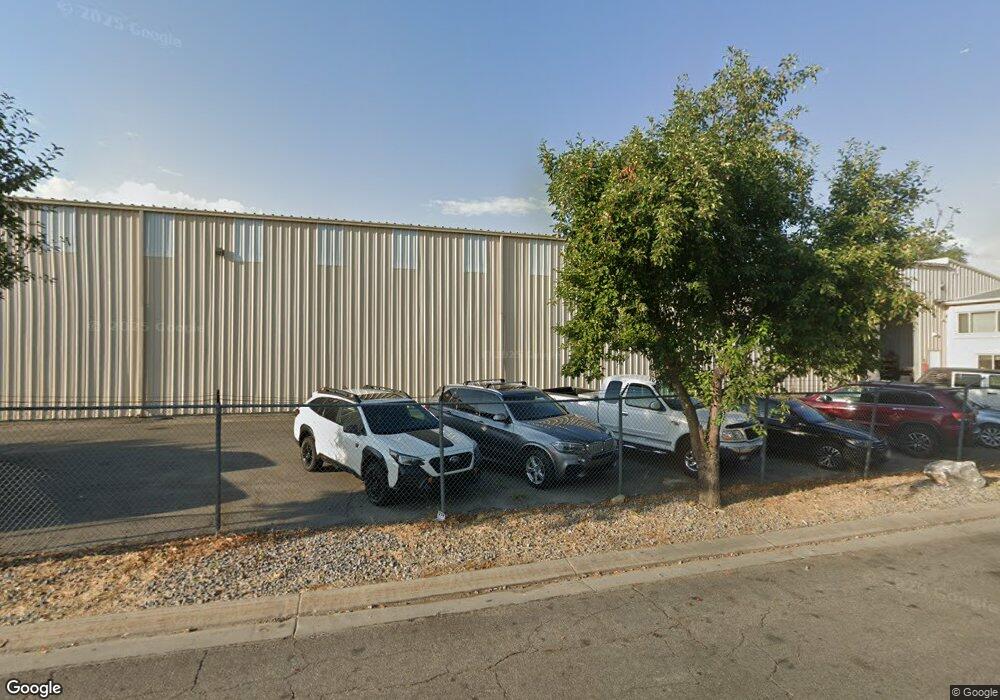
657 8th Ave Midvale, UT 84047
Studio
--
Bath
27,950
Sq Ft
10,019
Sq Ft Lot
About This Home
This home is located at 657 8th Ave, Midvale, UT 84047. 657 8th Ave is a home located in Salt Lake County with nearby schools including Midvale Elementary School, Midvale Middle School, and Hillcrest High School.
Ownership History
Date
Name
Owned For
Owner Type
Purchase Details
Closed on
Jul 18, 2024
Sold by
Robanser Family Trust and Robanser Fred
Bought by
Robanser Properties Llc
Purchase Details
Closed on
Aug 24, 2021
Sold by
Elmo Sorenson Jerry
Bought by
Jerry Elmo Sorenson Revocable Living Trust
Purchase Details
Closed on
Aug 23, 2021
Sold by
Sorenson Lee T and Sorenson Jerry Elmo
Bought by
Robnaser Fred and Robanser Jacque C
Purchase Details
Closed on
Sep 24, 2005
Sold by
Sorenson Jerry E and Sorenson Lee T
Bought by
Jerry & Lee Sorenson Llc
Purchase Details
Closed on
Sep 14, 2004
Sold by
Sorenson Jerry Elmo and Sorenson Lee T
Bought by
Sorenson Jerry Elmo and Sorenson Lee T
Home Financials for this Owner
Home Financials are based on the most recent Mortgage that was taken out on this home.
Original Mortgage
$850,000
Interest Rate
5.76%
Mortgage Type
Commercial
Create a Home Valuation Report for This Property
The Home Valuation Report is an in-depth analysis detailing your home's value as well as a comparison with similar homes in the area
Home Values in the Area
Average Home Value in this Area
Purchase History
| Date | Buyer | Sale Price | Title Company |
|---|---|---|---|
| Robanser Properties Llc | -- | None Listed On Document | |
| Jerry Elmo Sorenson Revocable Living Trust | -- | -- | |
| Robnaser Fred | -- | Stewart Title Ins Agcy Of Ut | |
| Jerry Elmo Sorenson Revocable Living Trust | -- | -- | |
| Jerry & Lee Sorenson Llc | -- | None Available | |
| Sorenson Jerry Elmo | -- | Title West |
Source: Public Records
Mortgage History
| Date | Status | Borrower | Loan Amount |
|---|---|---|---|
| Previous Owner | Sorenson Jerry Elmo | $850,000 |
Source: Public Records
Tax History
| Year | Tax Paid | Tax Assessment Tax Assessment Total Assessment is a certain percentage of the fair market value that is determined by local assessors to be the total taxable value of land and additions on the property. | Land | Improvement |
|---|---|---|---|---|
| 2025 | $43,981 | $4,480,300 | $1,705,400 | $2,774,900 |
| 2024 | $43,981 | $4,125,800 | $1,580,000 | $2,545,800 |
| 2023 | $35,026 | $3,776,700 | $1,404,500 | $2,372,200 |
| 2022 | $35,026 | $3,186,200 | $1,003,200 | $2,183,000 |
| 2021 | $35,850 | $2,798,400 | $464,500 | $2,333,900 |
| 2020 | $29,876 | $2,209,600 | $451,400 | $1,758,200 |
| 2019 | $25,140 | $1,815,000 | $414,300 | $1,400,700 |
| 2016 | $26,685 | $1,830,100 | $376,200 | $1,453,900 |
Source: Public Records
Map
Nearby Homes
- 578 7th Ave
- 576 7th Ave
- 636 W 4th Ave
- 620 W 2nd Ave
- 853 W Cannara Way
- 7346 S Sideline Ln Unit 44
- 7342 S Sideline Ln Unit 45
- 7340 S Sideline Ln Unit 46
- 7338 S Sideline Ln Unit 47
- 7336 S Sideline Ln Unit 48
- 7332 S Sideline Ln Unit 53
- 7330 S Sideline Ln Unit 54
- 7328 S Sideline Ln Unit 55
- 7326 S Sideline Ln Unit 56
- 7343 S Sideline Ln Unit 49
- 7341 S Sideline Ln Unit 50
- 7339 S Sideline Ln Unit 51
- 7337 S Sideline Ln Unit 52
- 7333 S Sideline Ln Unit 57
- 7331 S Sideline Ln Unit 58
Your Personal Tour Guide
Ask me questions while you tour the home.