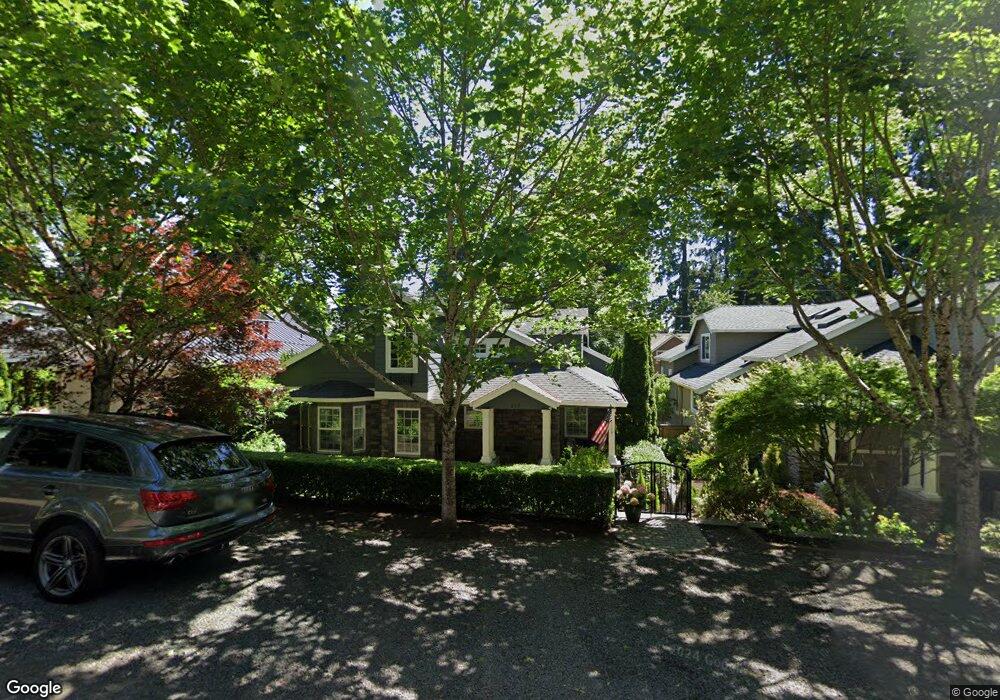
657 9th St Lake Oswego, OR 97034
Evergreen NeighborhoodEstimated Value: $1,690,881 - $1,989,000
3
Beds
3
Baths
2,812
Sq Ft
$658/Sq Ft
Est. Value
About This Home
This home is located at 657 9th St, Lake Oswego, OR 97034 and is currently estimated at $1,850,970, approximately $658 per square foot. 657 9th St is a home located in Clackamas County with nearby schools including Forest Hills Elementary School, Lake Oswego Junior High School, and Lake Oswego Senior High School.
Ownership History
Date
Name
Owned For
Owner Type
Purchase Details
Closed on
May 31, 2022
Sold by
Hokanson Roger B and Hokanson Michele L
Bought by
Hokanson Family Trust
Current Estimated Value
Purchase Details
Closed on
Sep 28, 2012
Sold by
Kunselman Andrew James and Kunselman Julia Lynn
Bought by
Hokanson Roger B and Hokanson Michele L
Purchase Details
Closed on
Jul 25, 2011
Sold by
Case John David and Case Mary Louise
Bought by
Kunselman Andrew James and Kunselman Julia Lynn
Home Financials for this Owner
Home Financials are based on the most recent Mortgage that was taken out on this home.
Original Mortgage
$119,000
Interest Rate
4.46%
Mortgage Type
Unknown
Create a Home Valuation Report for This Property
The Home Valuation Report is an in-depth analysis detailing your home's value as well as a comparison with similar homes in the area
Home Values in the Area
Average Home Value in this Area
Purchase History
| Date | Buyer | Sale Price | Title Company |
|---|---|---|---|
| Hokanson Family Trust | -- | Law Offices Of Nay & Friedenbe | |
| Hokanson Roger B | $699,000 | Lawyers Title | |
| Kunselman Andrew James | $670,000 | Ticor Title |
Source: Public Records
Mortgage History
| Date | Status | Borrower | Loan Amount |
|---|---|---|---|
| Previous Owner | Kunselman Andrew James | $119,000 | |
| Previous Owner | Kunselman Andrew James | $417,000 |
Source: Public Records
Tax History Compared to Growth
Tax History
| Year | Tax Paid | Tax Assessment Tax Assessment Total Assessment is a certain percentage of the fair market value that is determined by local assessors to be the total taxable value of land and additions on the property. | Land | Improvement |
|---|---|---|---|---|
| 2025 | $15,413 | $804,333 | -- | -- |
| 2024 | $15,002 | $780,906 | -- | -- |
| 2023 | $15,002 | $758,162 | $0 | $0 |
| 2022 | $14,129 | $736,080 | $0 | $0 |
| 2021 | $13,048 | $714,641 | $0 | $0 |
| 2020 | $12,721 | $693,827 | $0 | $0 |
| 2019 | $12,408 | $673,619 | $0 | $0 |
| 2018 | $11,799 | $653,999 | $0 | $0 |
| 2017 | $11,385 | $634,950 | $0 | $0 |
| 2016 | $10,363 | $616,456 | $0 | $0 |
| 2015 | $10,012 | $598,501 | $0 | $0 |
| 2014 | $9,883 | $581,069 | $0 | $0 |
Source: Public Records
Map
Nearby Homes