Estimated Value: $176,000 - $197,000
2
Beds
2
Baths
1,092
Sq Ft
$168/Sq Ft
Est. Value
About This Home
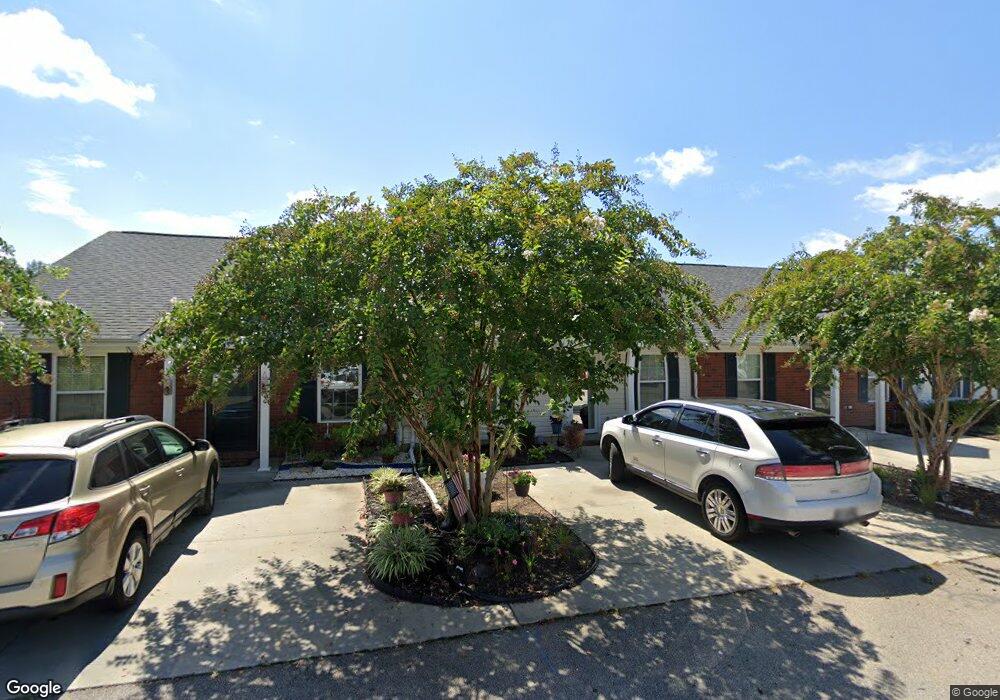
This home is located at 657 Brook Trail, Evans, GA 30809 and is currently estimated at $182,912, approximately $167 per square foot. 657 Brook Trail is a home located in Columbia County with nearby schools including Riverside Elementary School, Riverside Middle School, and Greenbrier High School.
Ownership History
Date
Name
Owned For
Owner Type
Purchase Details
Closed on
Jan 15, 2021
Sold by
Burton Mindi Faye
Bought by
Nichols Holdings Llc
Current Estimated Value
Purchase Details
Closed on
Apr 6, 2012
Sold by
Howland Bruce G
Bought by
Burton Mindi Faye
Purchase Details
Closed on
Jun 28, 2011
Sold by
Weathers Michael T
Bought by
Howland Bruce G
Home Financials for this Owner
Home Financials are based on the most recent Mortgage that was taken out on this home.
Original Mortgage
$82,159
Interest Rate
4.57%
Mortgage Type
FHA
Purchase Details
Closed on
Feb 28, 2007
Sold by
Gb Dev Llc
Bought by
Weathers Michael T
Home Financials for this Owner
Home Financials are based on the most recent Mortgage that was taken out on this home.
Original Mortgage
$89,672
Interest Rate
6.3%
Mortgage Type
New Conventional
Create a Home Valuation Report for This Property
The Home Valuation Report is an in-depth analysis detailing your home's value as well as a comparison with similar homes in the area
Home Values in the Area
Average Home Value in this Area
Purchase History
| Date | Buyer | Sale Price | Title Company |
|---|---|---|---|
| Nichols Holdings Llc | $105,000 | -- | |
| Burton Mindi Faye | $85,000 | -- | |
| Howland Bruce G | $84,300 | -- | |
| Howland Bruce G | $84,300 | -- | |
| Weathers Michael T | $89,700 | -- |
Source: Public Records
Mortgage History
| Date | Status | Borrower | Loan Amount |
|---|---|---|---|
| Previous Owner | Howland Bruce G | $82,159 | |
| Previous Owner | Weathers Michael T | $89,672 |
Source: Public Records
Tax History
| Year | Tax Paid | Tax Assessment Tax Assessment Total Assessment is a certain percentage of the fair market value that is determined by local assessors to be the total taxable value of land and additions on the property. | Land | Improvement |
|---|---|---|---|---|
| 2025 | $1,754 | $73,572 | $14,104 | $59,468 |
| 2024 | $1,754 | $70,223 | $13,404 | $56,819 |
| 2023 | $1,754 | $61,039 | $12,604 | $48,435 |
| 2022 | $1,091 | $42,000 | $8,280 | $33,720 |
| 2021 | $1,202 | $44,240 | $9,004 | $35,236 |
| 2020 | $1,071 | $38,610 | $8,004 | $30,606 |
| 2019 | $1,035 | $37,313 | $7,504 | $29,809 |
| 2018 | $1,008 | $36,198 | $7,204 | $28,994 |
| 2017 | $962 | $34,429 | $7,004 | $27,425 |
| 2016 | $889 | $32,984 | $6,680 | $26,304 |
| 2015 | $838 | $31,050 | $6,380 | $24,670 |
| 2014 | $870 | $31,853 | $6,680 | $25,173 |
Source: Public Records
Map
Nearby Homes
- 702 Creekside Dr
- 231 High Point Way
- 232 High Point Way
- 4832 Washington Rd
- 915 Kate Dr
- 1456 Knob Hill Cir
- 916 Kate Dr
- 1459 Knob Hill Cir
- 996 Woody Hill Cir
- 2034 Summerton Cir
- 2967 William Few Pkwy
- 1 Harding Ct
- 503 Avrett Ct
- 510 Avrett Ct
- 5107 Windmill Place
- 5123 Windmill Place
- 230 Callahan Dr
- 824 Windmill Crossing
- 971 Windmill Ln
- 917 Windmill Pkwy
- 659 Brook Trail
- 655 Brook Trail
- 653 Brook Trail
- 706 Creekside Dr
- 708 Creekside Dr
- 704 Creekside Dr
- 658 Brook Trail
- 656 Brook Trail
- 660 Brook Trail
- 654 Brook Trail
- 649 Brook Trail
- 700 Creekside Dr
- 652 Brook Trail
- 647 Brook Trail
- 650 Brook Trail
- 665 Brook Trail
- 645 Brook Trail
- 648 Brook Trail
- 714 Creekside Dr
- 667 Brook Trail
Your Personal Tour Guide
Ask me questions while you tour the home.