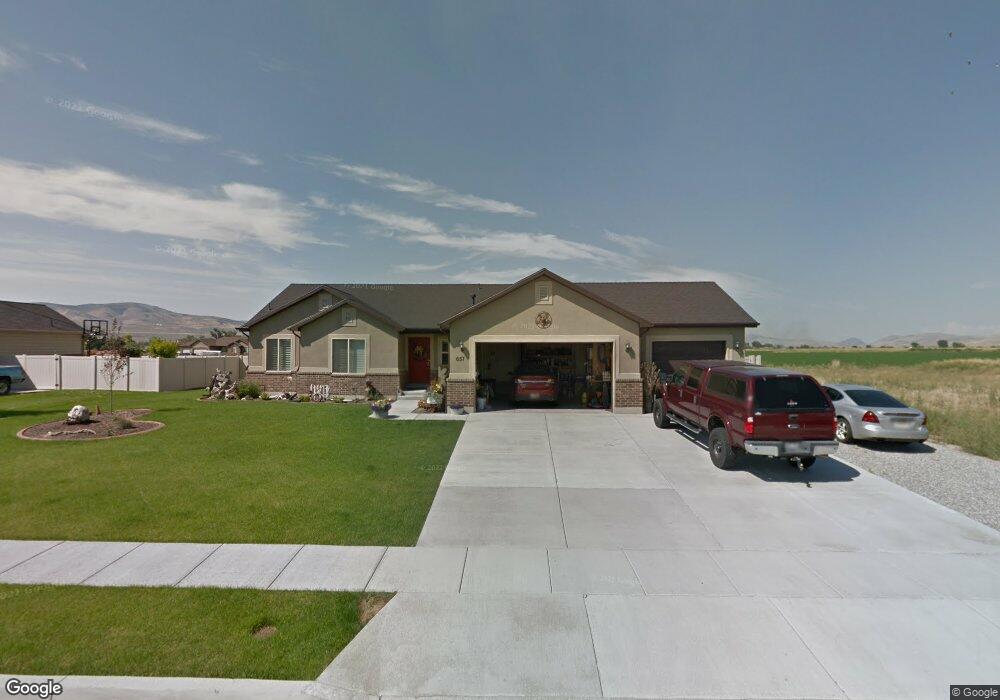
657 E 100 N Tremonton, UT 84337
Estimated Value: $528,483 - $588,000
3
Beds
2
Baths
3,300
Sq Ft
$167/Sq Ft
Est. Value
About This Home
This home is located at 657 E 100 N, Tremonton, UT 84337 and is currently estimated at $551,121, approximately $167 per square foot. 657 E 100 N is a home located in Box Elder County with nearby schools including North Park School, Bear River Middle School, and Alice C. Harris Intermediate School.
Ownership History
Date
Name
Owned For
Owner Type
Purchase Details
Closed on
Nov 6, 2013
Sold by
Sierra Homes Construction Inc
Bought by
Gurnsey Scott E and Gurnsey Karla J
Current Estimated Value
Home Financials for this Owner
Home Financials are based on the most recent Mortgage that was taken out on this home.
Original Mortgage
$275,793
Outstanding Balance
$205,998
Interest Rate
4.27%
Mortgage Type
FHA
Estimated Equity
$345,123
Purchase Details
Closed on
Jun 25, 2013
Sold by
Holmgren Investments Co Inc
Bought by
Sierra Homes Construction Inc
Home Financials for this Owner
Home Financials are based on the most recent Mortgage that was taken out on this home.
Original Mortgage
$211,000
Interest Rate
3.48%
Mortgage Type
New Conventional
Create a Home Valuation Report for This Property
The Home Valuation Report is an in-depth analysis detailing your home's value as well as a comparison with similar homes in the area
Home Values in the Area
Average Home Value in this Area
Purchase History
| Date | Buyer | Sale Price | Title Company |
|---|---|---|---|
| Gurnsey Scott E | -- | American Secure Title | |
| Sierra Homes Construction Inc | -- | Box Elder Land Title Co |
Source: Public Records
Mortgage History
| Date | Status | Borrower | Loan Amount |
|---|---|---|---|
| Open | Gurnsey Scott E | $275,793 | |
| Previous Owner | Sierra Homes Construction Inc | $211,000 |
Source: Public Records
Tax History Compared to Growth
Tax History
| Year | Tax Paid | Tax Assessment Tax Assessment Total Assessment is a certain percentage of the fair market value that is determined by local assessors to be the total taxable value of land and additions on the property. | Land | Improvement |
|---|---|---|---|---|
| 2025 | $3,247 | $557,374 | $150,000 | $407,374 |
| 2024 | $3,247 | $562,251 | $150,000 | $412,251 |
| 2023 | $3,432 | $583,520 | $155,000 | $428,520 |
| 2022 | $2,857 | $277,084 | $24,750 | $252,334 |
| 2021 | $2,427 | $359,881 | $45,000 | $314,881 |
| 2020 | $2,336 | $359,881 | $45,000 | $314,881 |
| 2019 | $2,166 | $178,011 | $24,750 | $153,261 |
| 2018 | $2,233 | $167,572 | $20,900 | $146,672 |
| 2017 | $2,307 | $304,676 | $20,900 | $266,676 |
| 2016 | $2,264 | $160,588 | $20,900 | $139,688 |
| 2015 | $2,042 | $147,889 | $20,900 | $126,989 |
| 2014 | $2,042 | $141,842 | $20,900 | $120,942 |
| 2013 | -- | $20,492 | $20,492 | $0 |
Source: Public Records
Map
Nearby Homes
- 1286 E 240 N Unit 15
- 635 E 240 N Unit 9
- 635 E 240 N
- 839 E 180 N Unit 30
- 137 N 870 W Unit 28
- Auburn Plan at River's Edge - Tremonton
- Aberdeen Plan at River's Edge - Tremonton
- Glendale Plan at River's Edge - Tremonton
- Lyndhurst Plan at River's Edge - Tremonton
- Sumac Plan at River's Edge - Tremonton
- Redwood Plan at River's Edge - Tremonton
- Summerlyn Plan at River's Edge - Tremonton
- Fairview Plan at River's Edge - Tremonton
- 518 E 40 S
- 408 N 775 E
- 155 E 300 N
- 575 N 300 E
- 225 E 600 N
- 760 N 680 E
- 758 N 400 E
- 657 E 100 N Unit 51
- 661 E 100 N Unit 50
- 661 E 100 N
- 651 E 100 N Unit 50
- 655 E 100 N
- 626 E 180 N
- 652 E 100 N Unit 53
- 685 E 100 N
- 656 E 100 N Unit 52
- 656 E 100 N
- 636 E 100 N Unit 52
- 670 E 100 N Unit 54
- 629 E 100 N Unit 13
- 629 E 100 N
- 662 E 100 N Unit 53
- 662 E 100 N
- 642 E 180 N
- 608 E 180 N
- 646 E 100 N
- 686 E 100 N Unit 55