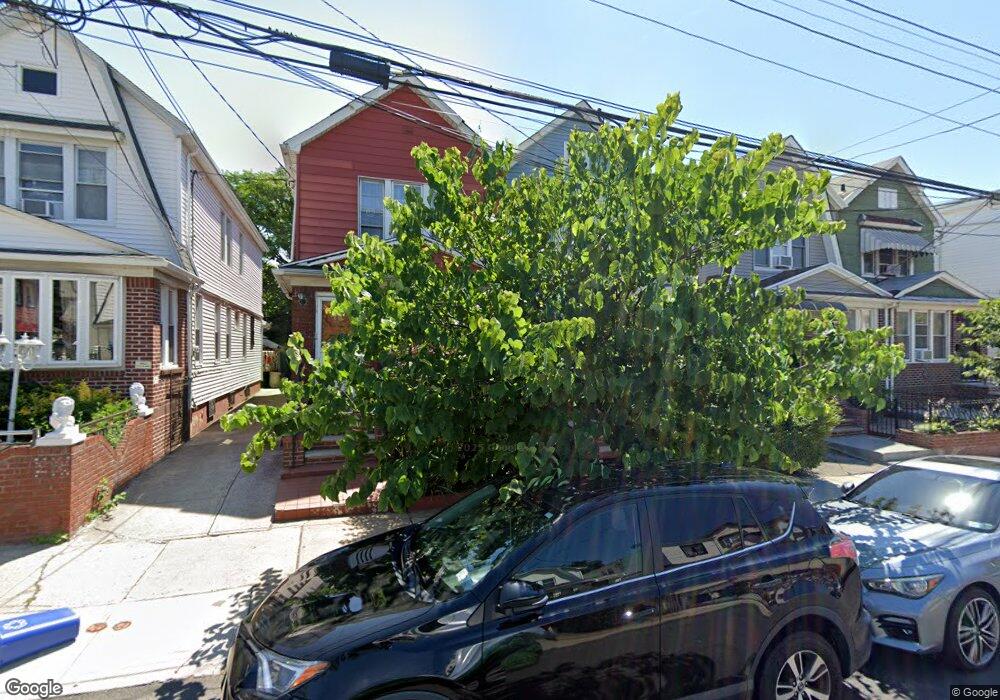
657 E 39th St Brooklyn, NY 11203
East Flatbush NeighborhoodEstimated Value: $641,635 - $852,000
Studio
--
Bath
1,408
Sq Ft
$542/Sq Ft
Est. Value
About This Home
This home is located at 657 E 39th St, Brooklyn, NY 11203 and is currently estimated at $763,659, approximately $542 per square foot. 657 E 39th St is a home located in Kings County with nearby schools including P.S. 198 Brooklyn, Andries Hudde School, and Central Brooklyn Ascend Charter.
Ownership History
Date
Name
Owned For
Owner Type
Purchase Details
Closed on
Jan 3, 2020
Sold by
Heyley J Job Trustee and Sheila Job Trust Dated December 17 2018
Bought by
Job Heyley J
Current Estimated Value
Purchase Details
Closed on
Feb 27, 2019
Sold by
Job Sheila Veronica
Bought by
Heyley J Job Trustee and Sheila Job Trust Dated December 17 2018
Purchase Details
Closed on
Aug 18, 1999
Sold by
Job Alva and Job Sheila
Bought by
Job Sheila Veronica
Home Financials for this Owner
Home Financials are based on the most recent Mortgage that was taken out on this home.
Original Mortgage
$100,000
Interest Rate
7.61%
Create a Home Valuation Report for This Property
The Home Valuation Report is an in-depth analysis detailing your home's value as well as a comparison with similar homes in the area
Home Values in the Area
Average Home Value in this Area
Purchase History
| Date | Buyer | Sale Price | Title Company |
|---|---|---|---|
| Job Heyley J | -- | -- | |
| Job Heyley J | -- | -- | |
| Job Heyley J | -- | -- | |
| Heyley J Job Trustee | -- | -- | |
| Heyley J Job Trustee | -- | -- | |
| Heyley J Job Trustee | -- | -- | |
| Job Sheila Veronica | -- | Chicago Title Insurance Co | |
| Job Sheila Veronica | -- | Chicago Title Insurance Co |
Source: Public Records
Mortgage History
| Date | Status | Borrower | Loan Amount |
|---|---|---|---|
| Previous Owner | Job Sheila Veronica | $100,000 |
Source: Public Records
Tax History
| Year | Tax Paid | Tax Assessment Tax Assessment Total Assessment is a certain percentage of the fair market value that is determined by local assessors to be the total taxable value of land and additions on the property. | Land | Improvement |
|---|---|---|---|---|
| 2025 | $6,117 | $42,120 | $12,780 | $29,340 |
| 2024 | $6,117 | $43,380 | $12,780 | $30,600 |
| 2023 | $5,835 | $43,740 | $12,780 | $30,960 |
| 2022 | $5,414 | $35,820 | $12,780 | $23,040 |
| 2021 | $5,392 | $27,660 | $12,780 | $14,880 |
| 2019 | $1,995 | $29,760 | $12,780 | $16,980 |
| 2018 | $1,781 | $23,943 | $10,019 | $13,924 |
| 2017 | $2,349 | $22,602 | $9,865 | $12,737 |
| 2016 | $1,513 | $21,349 | $11,397 | $9,952 |
| 2015 | $847 | $21,349 | $12,462 | $8,887 |
| 2014 | $847 | $21,150 | $13,658 | $7,492 |
Source: Public Records
Map
Nearby Homes
Your Personal Tour Guide
Ask me questions while you tour the home.