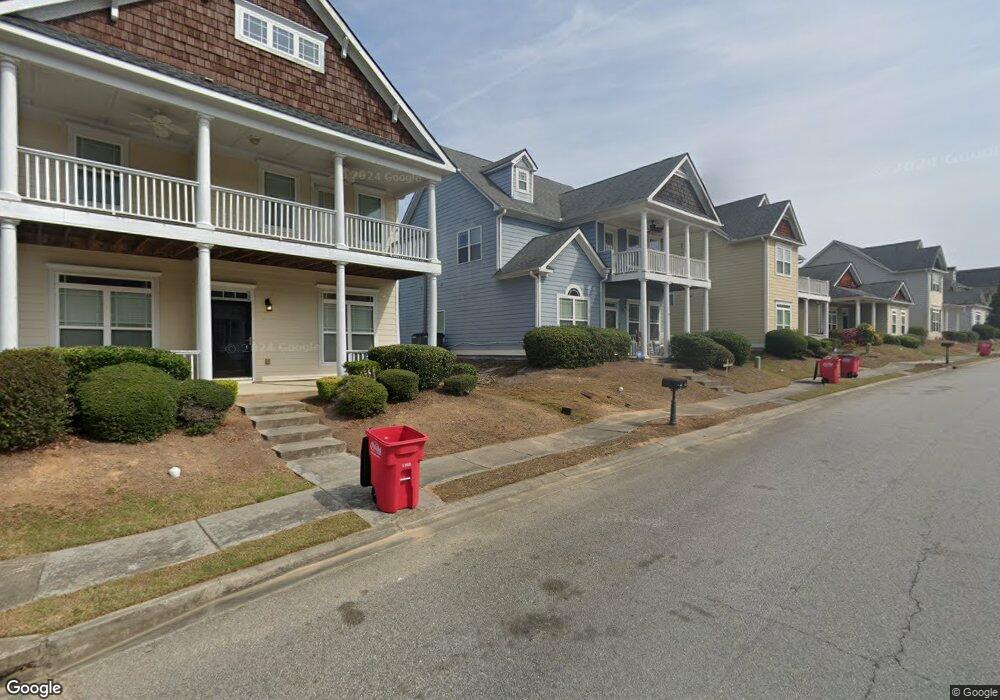
657 Ivy Brook Way Macon, GA 31210
Estimated Value: $235,000 - $254,000
4
Beds
3
Baths
2,242
Sq Ft
$109/Sq Ft
Est. Value
About This Home
This home is located at 657 Ivy Brook Way, Macon, GA 31210 and is currently estimated at $244,277, approximately $108 per square foot. 657 Ivy Brook Way is a home located in Bibb County with nearby schools including Carter Elementary School, Howard Middle School, and Howard High School.
Ownership History
Date
Name
Owned For
Owner Type
Purchase Details
Closed on
Nov 19, 2021
Sold by
Enck Melissa Johnson and Johnson Melissa A
Bought by
Enck Melissa Johnson
Current Estimated Value
Home Financials for this Owner
Home Financials are based on the most recent Mortgage that was taken out on this home.
Original Mortgage
$113,150
Outstanding Balance
$103,611
Interest Rate
3.09%
Mortgage Type
FHA
Estimated Equity
$140,666
Purchase Details
Closed on
Jun 30, 2016
Sold by
Ocain Charles M
Bought by
Johnson Melissa A
Home Financials for this Owner
Home Financials are based on the most recent Mortgage that was taken out on this home.
Original Mortgage
$121,259
Interest Rate
4.5%
Mortgage Type
FHA
Purchase Details
Closed on
Jul 13, 2005
Bought by
O'Cain Charles M and O'Cain Amy
Home Financials for this Owner
Home Financials are based on the most recent Mortgage that was taken out on this home.
Original Mortgage
$142,425
Interest Rate
5.54%
Mortgage Type
New Conventional
Purchase Details
Closed on
Mar 22, 2005
Create a Home Valuation Report for This Property
The Home Valuation Report is an in-depth analysis detailing your home's value as well as a comparison with similar homes in the area
Home Values in the Area
Average Home Value in this Area
Purchase History
| Date | Buyer | Sale Price | Title Company |
|---|---|---|---|
| Enck Melissa Johnson | -- | Avenue 365 Lender Svcs Llc | |
| Johnson Melissa A | $123,497 | -- | |
| O'Cain Charles M | $178,000 | -- | |
| Ocain Charles M | $178,032 | None Available | |
| -- | $87,000 | -- |
Source: Public Records
Mortgage History
| Date | Status | Borrower | Loan Amount |
|---|---|---|---|
| Open | Enck Melissa Johnson | $113,150 | |
| Closed | Johnson Melissa A | $121,259 | |
| Previous Owner | Ocain Charles M | $142,425 | |
| Previous Owner | O'Cain Charles M | $35,607 |
Source: Public Records
Tax History Compared to Growth
Tax History
| Year | Tax Paid | Tax Assessment Tax Assessment Total Assessment is a certain percentage of the fair market value that is determined by local assessors to be the total taxable value of land and additions on the property. | Land | Improvement |
|---|---|---|---|---|
| 2025 | $2,234 | $90,890 | $8,000 | $82,890 |
| 2024 | $2,108 | $82,996 | $8,000 | $74,996 |
| 2023 | $2,108 | $82,996 | $8,000 | $74,996 |
| 2022 | $2,596 | $74,974 | $12,400 | $62,574 |
| 2021 | $2,287 | $60,195 | $10,136 | $50,059 |
| 2020 | $2,295 | $59,107 | $10,136 | $48,971 |
| 2019 | $1,952 | $49,863 | $7,240 | $42,623 |
| 2018 | $3,080 | $48,382 | $7,240 | $41,142 |
| 2017 | $1,813 | $48,382 | $7,240 | $41,142 |
| 2016 | $1,674 | $48,382 | $7,240 | $41,142 |
| 2015 | $2,369 | $48,382 | $7,240 | $41,142 |
| 2014 | $2,030 | $48,382 | $7,240 | $41,142 |
Source: Public Records
Map
Nearby Homes
- 715 Ivy Brook Way
- 740 Ivy Brook Way
- 2006 Fall Harvest Dr Unit LOT 278
- 2002 Fall Harvest Dr Unit LOT 280
- 2006 Fall Harvest Dr
- 2002 Fall Harvest Dr
- 2008 Fall Harvest Dr Unit LOT 277
- 2004 Fall Harvest Dr
- 2010 Fall Harvest Dr Unit LOT 276
- 2010 Fall Harvest Dr
- 2008 Fall Harvest Dr
- 2004 Fall Harvest Dr Unit LOT 279
- 631 Ivy Brook Way
- 776 Ivy Brook Way
- 785 Ivy Brook Way
- 621 Ivy Brook Way
- 534 Ivy Brook Way
- 117 Legare Ct
- 657 Ivy Brook Way Unit 70
- 659 Ivy Brook Way
- 655 Ivy Brook Way
- 661 Ivy Brook Way
- 653 Ivy Brook Way
- 725 Ivy Brook Way
- 729 Ivy Brook Way
- 651 Ivy Brook Way
- 731 Ivy Brook Way
- 719 Ivy Brook Way
- 715 Ivy Brook Way Unit 79
- 735 Ivy Brook Way
- 658 Ivy Brook Way
- 656 Ivy Brook Way
- 709 Ivy Brook Way
- 649 Ivy Brook Way
- 660 Ivy Brook Way
- 677 Ivy Brook Way
- 719 Ivey Brook Way
- 679 Ivy Brook Way