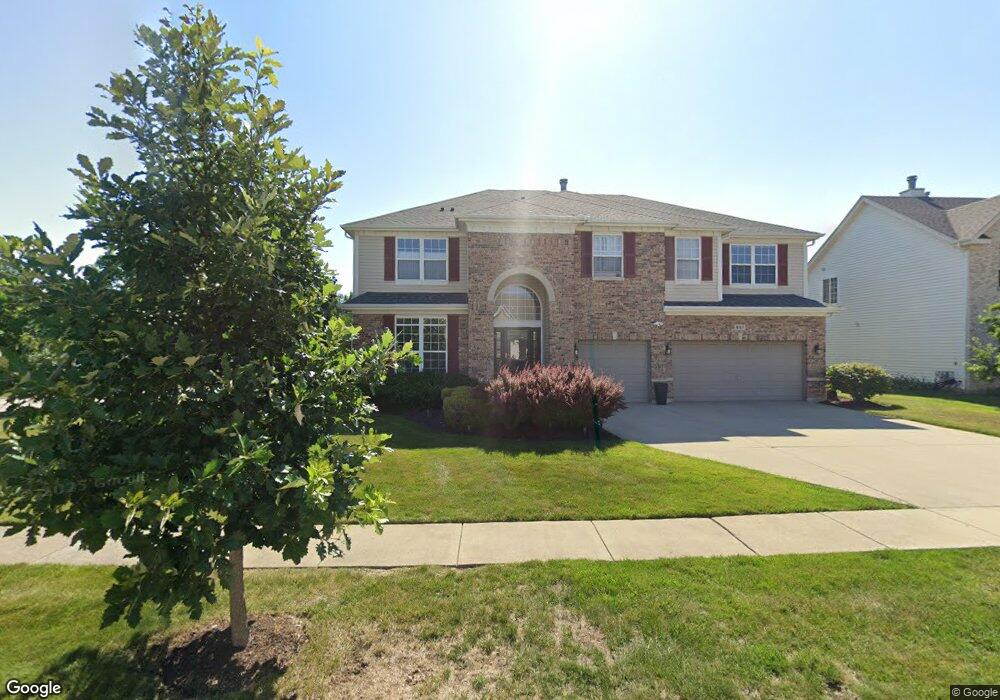
657 Kathy Ln Schaumburg, IL 60173
East Schaumburg NeighborhoodEstimated Value: $955,849 - $1,007,000
5
Beds
4
Baths
3,741
Sq Ft
$264/Sq Ft
Est. Value
About This Home
This home is located at 657 Kathy Ln, Schaumburg, IL 60173 and is currently estimated at $986,462, approximately $263 per square foot. 657 Kathy Ln is a home located in Cook County with nearby schools including Fairview Elementary School, Helen Keller Junior High School, and J B Conant High School.
Ownership History
Date
Name
Owned For
Owner Type
Purchase Details
Closed on
May 21, 2024
Sold by
Thakker Snehal V and Thakker Payal S
Bought by
Thakker Family Trust and Thakker
Current Estimated Value
Purchase Details
Closed on
May 1, 2017
Sold by
Graham Stephen A and Graham Phyllis A
Bought by
Thakker Snehal V and Thakker Payal S
Home Financials for this Owner
Home Financials are based on the most recent Mortgage that was taken out on this home.
Original Mortgage
$424,000
Interest Rate
3.48%
Mortgage Type
Adjustable Rate Mortgage/ARM
Purchase Details
Closed on
May 5, 1998
Sold by
The Northern Trust Company
Bought by
Graham Stephen A and Graham Phyllis A
Home Financials for this Owner
Home Financials are based on the most recent Mortgage that was taken out on this home.
Original Mortgage
$355,400
Interest Rate
7.18%
Mortgage Type
Purchase Money Mortgage
Create a Home Valuation Report for This Property
The Home Valuation Report is an in-depth analysis detailing your home's value as well as a comparison with similar homes in the area
Home Values in the Area
Average Home Value in this Area
Purchase History
| Date | Buyer | Sale Price | Title Company |
|---|---|---|---|
| Thakker Family Trust | -- | None Listed On Document | |
| Thakker Snehal V | $620,000 | Chicago Title Company | |
| Graham Stephen A | $444,500 | Ticor Title |
Source: Public Records
Mortgage History
| Date | Status | Borrower | Loan Amount |
|---|---|---|---|
| Previous Owner | Thakker Snehal V | $424,000 | |
| Previous Owner | Graham Stephen A | $355,400 |
Source: Public Records
Tax History
| Year | Tax Paid | Tax Assessment Tax Assessment Total Assessment is a certain percentage of the fair market value that is determined by local assessors to be the total taxable value of land and additions on the property. | Land | Improvement |
|---|---|---|---|---|
| 2025 | $19,329 | $90,000 | $26,961 | $63,039 |
| 2024 | $19,329 | $69,000 | $22,876 | $46,124 |
| 2023 | $18,743 | $69,000 | $22,876 | $46,124 |
| 2022 | $18,743 | $69,000 | $22,876 | $46,124 |
| 2021 | $16,637 | $54,891 | $16,748 | $38,143 |
| 2020 | $16,351 | $54,891 | $16,748 | $38,143 |
| 2019 | $16,348 | $60,990 | $16,748 | $44,242 |
| 2018 | $17,540 | $58,444 | $13,889 | $44,555 |
| 2017 | $18,189 | $64,953 | $13,889 | $51,064 |
| 2016 | $17,993 | $67,634 | $13,889 | $53,745 |
| 2015 | $17,028 | $59,541 | $12,255 | $47,286 |
| 2014 | $16,857 | $59,541 | $12,255 | $47,286 |
| 2013 | $17,178 | $62,212 | $12,255 | $49,957 |
Source: Public Records
Map
Nearby Homes
- 796 Stonewall Ct
- 812 Dracut Ln Unit D
- 848 Newbury Ct
- 624 Breakers Point Unit 53C
- 600 Stone Circle Ct Unit W1
- 600 Eastview Ct Unit X1
- 601 Eastview Ct Unit Z1
- 141 Chatsworth Cir
- 1190 Ash Rd
- 1532 Petersham Ln
- 151 Brookston Dr Unit A2
- 150 Fulbright Ln
- 1251 Williamsburg Dr Unit D-1
- 1232 Plum Tree Ct Unit A2
- 1220 Plum Tree Ct Unit 2D
- 100 Des Plaines Ln
- 310 Oak Meadow Ct Unit D2
- 275 Wilmette Ct Unit B1
- 317 Woodbury Ct Unit B1
- 800 Linden Cir
- 653 Kathy Ln
- 849 Morningside Dr
- 820 Heatherstone Dr
- 844 Morningside Dr
- 824 Heatherstone Dr
- 848 Morningside Dr
- 853 Morningside Dr
- 654 Kathy Ln
- 658 Kathy Ln
- 840 Morningside Dr
- 828 Heatherstone Dr
- 650 Kathy Ln
- 852 Morningside Dr
- 836 Morningside Dr
- 812 Heatherstone Dr
- 857 Morningside Dr
- 856 Morningside Dr
- 832 Heatherstone Dr
- 832 Morningside Dr
- 808 Heatherstone Dr
Your Personal Tour Guide
Ask me questions while you tour the home.