Estimated Value: $294,000 - $326,000
3
Beds
2
Baths
1,585
Sq Ft
$192/Sq Ft
Est. Value
About This Home
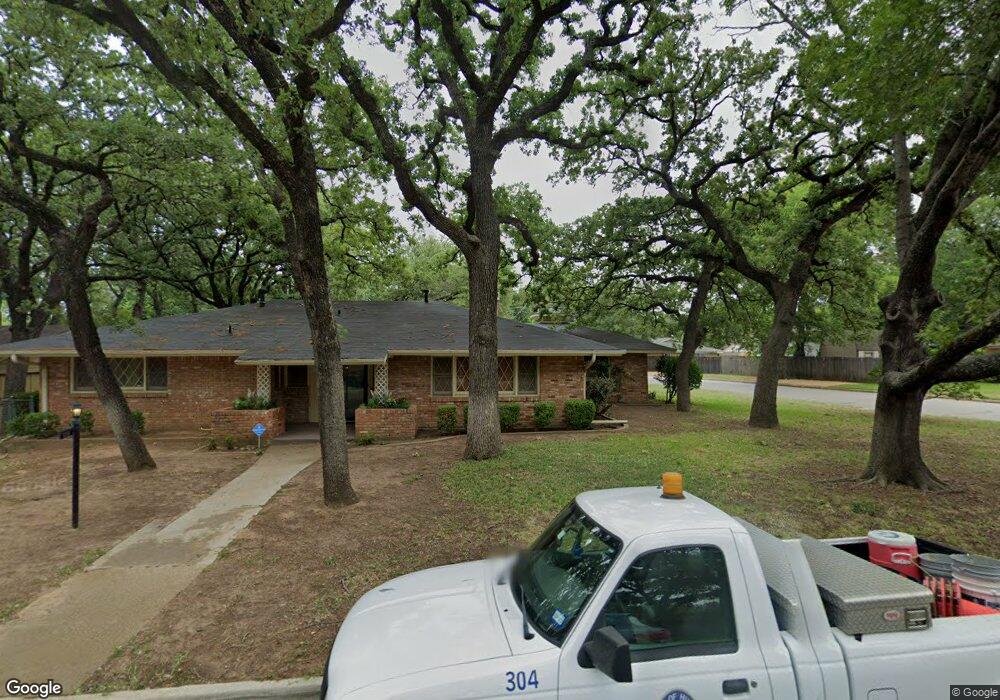
This home is located at 657 Ponderosa Dr, Hurst, TX 76053 and is currently estimated at $303,654, approximately $191 per square foot. 657 Ponderosa Dr is a home located in Tarrant County with nearby schools including West Hurst Elementary School, Hurst J High School, and L.D. Bell High School.
Ownership History
Date
Name
Owned For
Owner Type
Purchase Details
Closed on
Jan 27, 1995
Sold by
Anderson Edna N
Bought by
Roberts Sidney and Roberts Bobbie
Current Estimated Value
Purchase Details
Closed on
Jan 11, 1994
Sold by
Anderson Edna N
Bought by
Roberts Sidney and Roberts Bobbie
Create a Home Valuation Report for This Property
The Home Valuation Report is an in-depth analysis detailing your home's value as well as a comparison with similar homes in the area
Home Values in the Area
Average Home Value in this Area
Purchase History
| Date | Buyer | Sale Price | Title Company |
|---|---|---|---|
| Roberts Sidney | -- | -- | |
| Roberts Sidney | -- | -- |
Source: Public Records
Tax History Compared to Growth
Tax History
| Year | Tax Paid | Tax Assessment Tax Assessment Total Assessment is a certain percentage of the fair market value that is determined by local assessors to be the total taxable value of land and additions on the property. | Land | Improvement |
|---|---|---|---|---|
| 2025 | $677 | $271,710 | $60,000 | $211,710 |
| 2024 | $677 | $271,710 | $60,000 | $211,710 |
| 2023 | $4,436 | $275,349 | $30,000 | $245,349 |
| 2022 | $4,635 | $229,476 | $30,000 | $199,476 |
| 2021 | $4,414 | $206,024 | $30,000 | $176,024 |
| 2020 | $4,003 | $167,827 | $30,000 | $137,827 |
| 2019 | $3,702 | $163,176 | $30,000 | $133,176 |
| 2018 | $853 | $137,492 | $18,000 | $119,492 |
| 2017 | $3,163 | $142,189 | $18,000 | $124,189 |
| 2016 | $2,875 | $125,407 | $18,000 | $107,407 |
| 2015 | $914 | $103,300 | $18,000 | $85,300 |
| 2014 | $914 | $103,300 | $18,000 | $85,300 |
Source: Public Records
Map
Nearby Homes
- 425 Ridgecrest Dr
- 408 Simmons Dr
- 744 Briarwood Ln
- 741 Ponderosa Dr
- 520 W Redbud Dr
- 756 Briarwood Ln
- 758 Briarwood Ln
- 628 Elm St
- 612 Elm St
- 637 Post Oak Dr
- 708 Hurstview Dr
- 516 Hurstview Dr
- 425 Moore Creek Rd
- 808 Betty Ct
- 231 Elm St
- 125 Souder Dr
- 120 Charlene Dr
- 632 Forest Ln
- 624 Harrison Ln
- 552 Norwood Dr
- 653 Ponderosa Dr
- 701 Ponderosa Dr
- 628 W Redbud Dr
- 649 Ponderosa Dr
- 501 Ridgecrest Dr
- 624 W Redbud Dr
- 648 Ponderosa Dr
- 644 Ponderosa Dr
- 704 W Redbud Dr
- 705 Ponderosa Dr
- 700 Ponderosa Dr
- 640 Ponderosa Dr
- 645 Ponderosa Dr
- 620 W Redbud Dr
- 708 W Redbud Dr
- 709 Ponderosa Dr
- 704 Ponderosa Dr
- 636 Ponderosa Dr
- 625 W Redbud Dr
- 429 Ridgecrest Dr