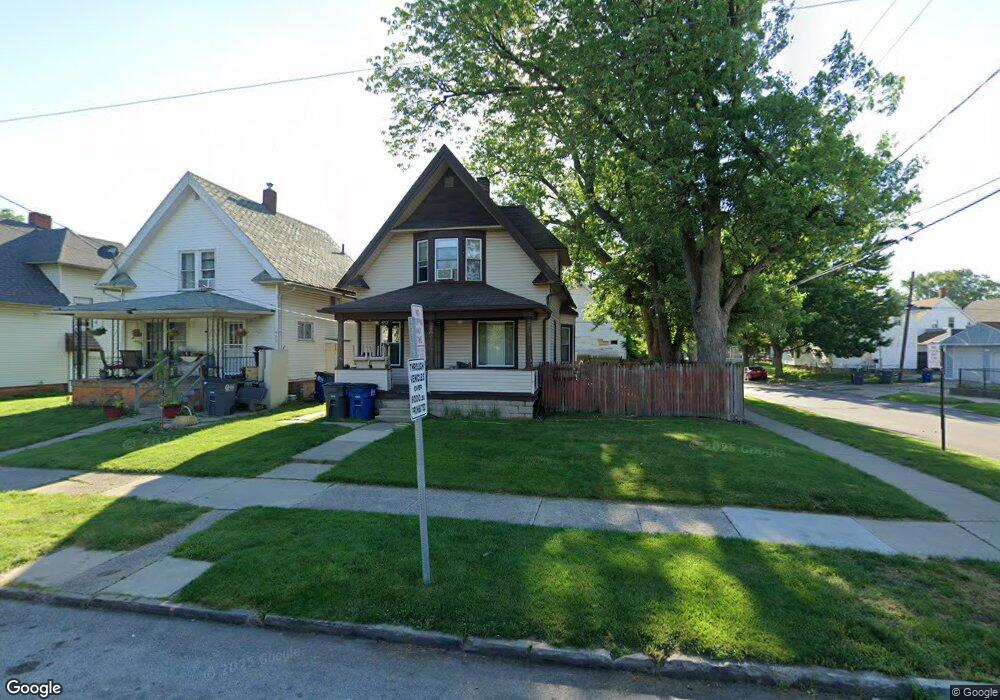
657 Utah St Toledo, OH 43605
East Toledo NeighborhoodEstimated Value: $54,568 - $67,000
3
Beds
1
Bath
1,210
Sq Ft
$50/Sq Ft
Est. Value
About This Home
This home is located at 657 Utah St, Toledo, OH 43605 and is currently estimated at $60,642, approximately $50 per square foot. 657 Utah St is a home located in Lucas County with nearby schools including Navarre Elementary School, Waite High School, and L. Hollingworth School For Talented And Gifted.
Ownership History
Date
Name
Owned For
Owner Type
Purchase Details
Closed on
Sep 14, 2001
Sold by
Hannum James C
Bought by
Braden Carl F
Current Estimated Value
Home Financials for this Owner
Home Financials are based on the most recent Mortgage that was taken out on this home.
Original Mortgage
$48,111
Outstanding Balance
$18,815
Interest Rate
7.03%
Mortgage Type
FHA
Estimated Equity
$41,827
Purchase Details
Closed on
Mar 1, 1988
Sold by
Brummett Roy A and Brummett Sharon
Create a Home Valuation Report for This Property
The Home Valuation Report is an in-depth analysis detailing your home's value as well as a comparison with similar homes in the area
Home Values in the Area
Average Home Value in this Area
Purchase History
| Date | Buyer | Sale Price | Title Company |
|---|---|---|---|
| Braden Carl F | $48,000 | Midland | |
| -- | $22,000 | -- |
Source: Public Records
Mortgage History
| Date | Status | Borrower | Loan Amount |
|---|---|---|---|
| Open | Braden Carl F | $48,111 |
Source: Public Records
Tax History Compared to Growth
Tax History
| Year | Tax Paid | Tax Assessment Tax Assessment Total Assessment is a certain percentage of the fair market value that is determined by local assessors to be the total taxable value of land and additions on the property. | Land | Improvement |
|---|---|---|---|---|
| 2024 | $971 | $10,710 | $3,815 | $6,895 |
| 2023 | $863 | $9,450 | $4,480 | $4,970 |
| 2022 | $867 | $9,450 | $4,480 | $4,970 |
| 2021 | $862 | $9,450 | $4,480 | $4,970 |
| 2020 | $933 | $9,135 | $4,270 | $4,865 |
| 2019 | $923 | $9,135 | $4,270 | $4,865 |
| 2018 | $920 | $9,135 | $4,270 | $4,865 |
| 2017 | $940 | $8,925 | $4,165 | $4,760 |
| 2016 | $941 | $25,500 | $11,900 | $13,600 |
| 2015 | $931 | $25,500 | $11,900 | $13,600 |
| 2014 | $562 | $8,930 | $4,170 | $4,760 |
| 2013 | $562 | $8,930 | $4,170 | $4,760 |
Source: Public Records
Map
Nearby Homes
- 629 Clark St
- 734 Oak St
- 525 Yondota St
- 58 Greenwood Ave
- 44 Greenwood Ave
- 548 Saint Louis St
- 637 Milton St
- 871 Oak St
- 426 Oak St
- 522 Saint Louis St
- 423 Oak St
- 428 Potter St
- 414 Utah St
- 540 Arden Place
- 847 Mckinley Ave
- 452 Saint Louis St
- 426 Arden Place
- 921 Butler St
- 627 Greenwood Ave
- 51 Garfield Place