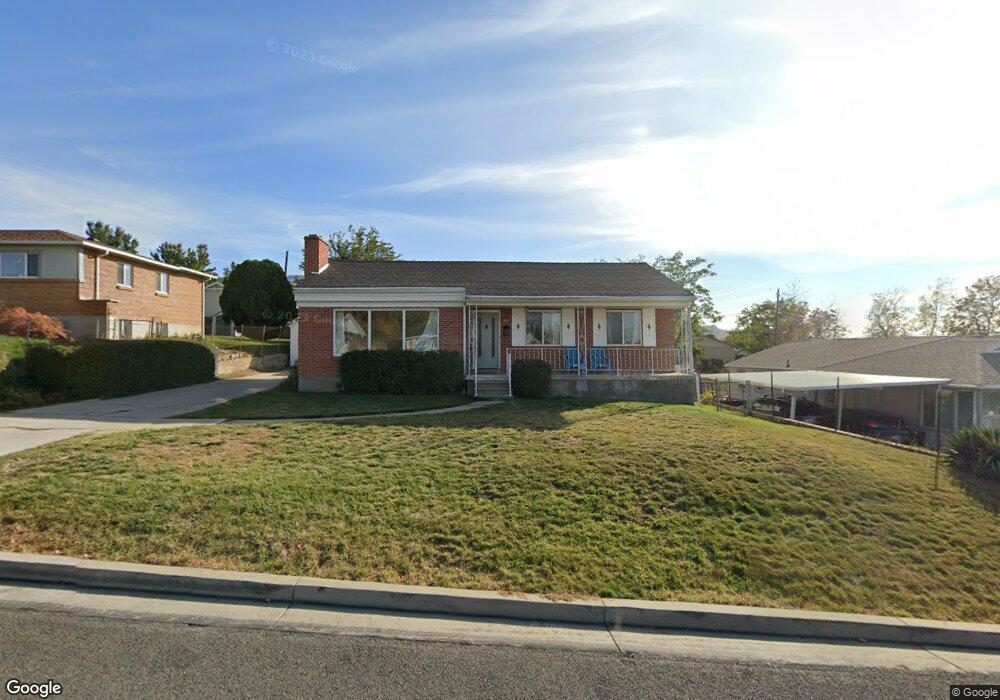
657 W 3500 S Bountiful, UT 84010
Estimated Value: $487,000 - $544,000
3
Beds
1
Bath
2,200
Sq Ft
$233/Sq Ft
Est. Value
About This Home
This home is located at 657 W 3500 S, Bountiful, UT 84010 and is currently estimated at $512,226, approximately $232 per square foot. 657 W 3500 S is a home located in Davis County with nearby schools including Adelaide School, South Davis Junior High School, and Woods Cross High School.
Ownership History
Date
Name
Owned For
Owner Type
Purchase Details
Closed on
Jul 27, 2018
Sold by
Levitre Jonathon B and Levitre Jennifer
Bought by
Levitre Jonathon Brett and Levitre Jennifer C
Current Estimated Value
Home Financials for this Owner
Home Financials are based on the most recent Mortgage that was taken out on this home.
Original Mortgage
$228,750
Outstanding Balance
$199,094
Interest Rate
4.6%
Mortgage Type
New Conventional
Estimated Equity
$313,132
Purchase Details
Closed on
Dec 28, 2010
Sold by
Jones Barbara E
Bought by
Levitre Jonathon B and Levitre Jennifer
Home Financials for this Owner
Home Financials are based on the most recent Mortgage that was taken out on this home.
Original Mortgage
$124,000
Interest Rate
4.34%
Mortgage Type
New Conventional
Purchase Details
Closed on
Aug 10, 2010
Sold by
Jones Barbara E
Bought by
Jones Barbara E
Create a Home Valuation Report for This Property
The Home Valuation Report is an in-depth analysis detailing your home's value as well as a comparison with similar homes in the area
Purchase History
| Date | Buyer | Sale Price | Title Company |
|---|---|---|---|
| Levitre Jonathon Brett | -- | Backman Title | |
| Levitre Jonathon B | -- | Equity Title Ins Agency Inc | |
| Jones Barbara E | -- | None Available | |
| Jones Barbara E | -- | None Available |
Source: Public Records
Mortgage History
| Date | Status | Borrower | Loan Amount |
|---|---|---|---|
| Open | Levitre Jonathon Brett | $228,750 | |
| Closed | Levitre Jonathon B | $124,000 |
Source: Public Records
Tax History
| Year | Tax Paid | Tax Assessment Tax Assessment Total Assessment is a certain percentage of the fair market value that is determined by local assessors to be the total taxable value of land and additions on the property. | Land | Improvement |
|---|---|---|---|---|
| 2025 | $2,855 | $257,951 | $140,322 | $117,629 |
| 2024 | $2,607 | $238,699 | $127,857 | $110,842 |
| 2023 | $2,521 | $228,800 | $128,119 | $100,680 |
| 2022 | $2,317 | $402,000 | $230,165 | $171,835 |
| 2021 | $2,153 | $312,000 | $165,770 | $146,230 |
| 2020 | $1,950 | $276,000 | $140,661 | $135,339 |
| 2019 | $1,957 | $272,000 | $142,287 | $129,713 |
| 2018 | $1,788 | $248,000 | $139,336 | $108,664 |
| 2016 | $1,392 | $110,440 | $46,939 | $63,501 |
| 2015 | $1,326 | $99,935 | $46,939 | $52,996 |
| 2014 | $1,314 | $101,128 | $46,939 | $54,189 |
| 2013 | -- | $104,600 | $41,360 | $63,240 |
Source: Public Records
Map
Nearby Homes
- 652 W 3600 S
- 310 N 675 E
- 3279 Plum Tree Ln
- 678 W 3200 S
- 746 W 3200 S
- 527 Applewood Dr
- 468 W 3200 S
- 328 Pellinore St Unit 44
- 683 Merlin St Unit 4630
- 558 Eastpointe Cir
- 246 N Glenwood Way
- 178 N Valley View Dr
- 336 W 3500 S
- 256 Excalibur St Unit 163
- 294 Springridge Dr
- 246 Guenevere St Unit 81
- 252 E Kirsten Ln
- 562 Lancelot Dr Unit 60
- 816 W 4100 S
- 246 Galahad St
Your Personal Tour Guide
Ask me questions while you tour the home.