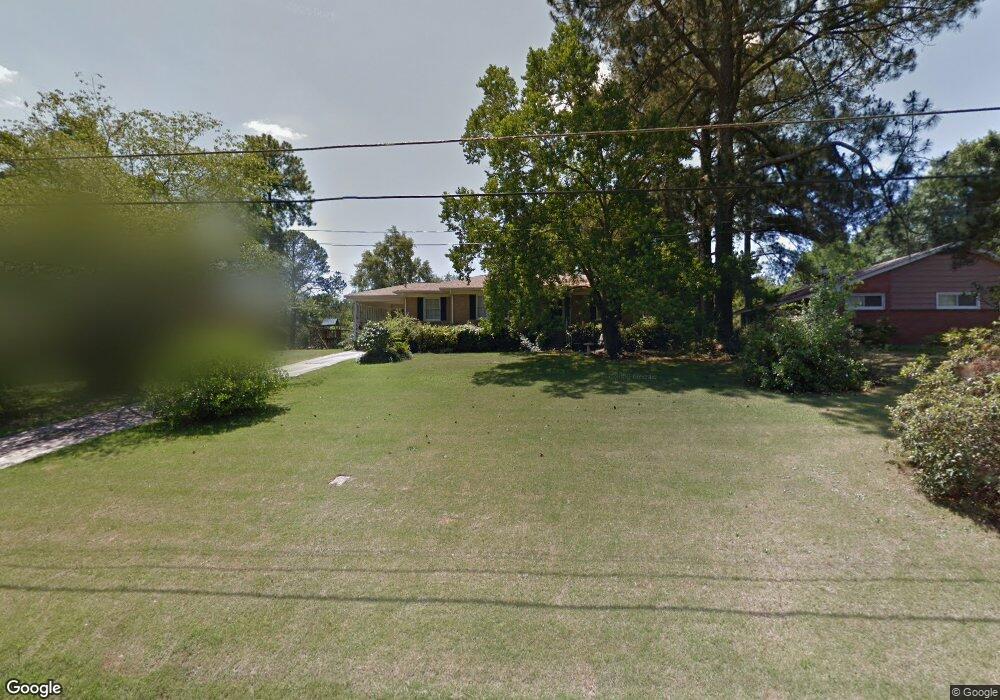
657 Woodridge Dr Macon, GA 31204
Estimated Value: $162,788 - $189,000
3
Beds
2
Baths
1,416
Sq Ft
$121/Sq Ft
Est. Value
About This Home
This home is located at 657 Woodridge Dr, Macon, GA 31204 and is currently estimated at $171,947, approximately $121 per square foot. 657 Woodridge Dr is a home located in Bibb County with nearby schools including Rosa Taylor Elementary School, Howard Middle School, and Howard High School.
Ownership History
Date
Name
Owned For
Owner Type
Purchase Details
Closed on
Mar 27, 2024
Sold by
Dina Properties Llc
Bought by
Mmw Holdings Llc
Current Estimated Value
Home Financials for this Owner
Home Financials are based on the most recent Mortgage that was taken out on this home.
Original Mortgage
$440,000
Outstanding Balance
$432,693
Interest Rate
6.94%
Mortgage Type
New Conventional
Estimated Equity
-$260,746
Purchase Details
Closed on
Mar 9, 2017
Sold by
Hurley Sally H
Bought by
Dina Properties Llc
Home Financials for this Owner
Home Financials are based on the most recent Mortgage that was taken out on this home.
Original Mortgage
$35,000
Interest Rate
4.17%
Mortgage Type
New Conventional
Purchase Details
Closed on
Aug 3, 2007
Sold by
Hurley John Robert
Bought by
Hurley Sally H
Purchase Details
Closed on
May 17, 2006
Sold by
Hurley Anne Lee
Bought by
Hurley Sally H and Hurley John Robert
Purchase Details
Closed on
Dec 28, 2004
Bought by
Hurley Sally H and Hurley
Create a Home Valuation Report for This Property
The Home Valuation Report is an in-depth analysis detailing your home's value as well as a comparison with similar homes in the area
Home Values in the Area
Average Home Value in this Area
Purchase History
| Date | Buyer | Sale Price | Title Company |
|---|---|---|---|
| Mmw Holdings Llc | $440,000 | None Listed On Document | |
| Dina Properties Llc | $45,000 | -- | |
| Hurley Sally H | -- | None Available | |
| Hurley Sally H | -- | None Available | |
| Hurley Sally H | -- | -- |
Source: Public Records
Mortgage History
| Date | Status | Borrower | Loan Amount |
|---|---|---|---|
| Open | Mmw Holdings Llc | $440,000 | |
| Previous Owner | Dina Properties Llc | $35,000 |
Source: Public Records
Tax History Compared to Growth
Tax History
| Year | Tax Paid | Tax Assessment Tax Assessment Total Assessment is a certain percentage of the fair market value that is determined by local assessors to be the total taxable value of land and additions on the property. | Land | Improvement |
|---|---|---|---|---|
| 2025 | $1,284 | $52,234 | $12,000 | $40,234 |
| 2024 | $1,359 | $53,505 | $12,000 | $41,505 |
| 2023 | $1,117 | $43,972 | $12,000 | $31,972 |
| 2022 | $1,482 | $42,800 | $6,896 | $35,904 |
| 2021 | $1,379 | $36,289 | $6,345 | $29,944 |
| 2020 | $1,368 | $35,225 | $6,345 | $28,880 |
| 2019 | $1,379 | $35,225 | $6,345 | $28,880 |
| 2018 | $1,259 | $31,752 | $6,069 | $25,683 |
| 2017 | $1,081 | $28,857 | $6,147 | $22,710 |
| 2016 | $755 | $28,814 | $6,147 | $22,667 |
| 2015 | $1,173 | $30,940 | $6,147 | $24,793 |
| 2014 | $1,400 | $30,940 | $6,147 | $24,793 |
Source: Public Records
Map
Nearby Homes
- 648 Willow Creek Dr
- 2988 Crestline Dr
- 615 Willow Creek Dr
- 603 Willow Creek Dr
- 740 Valley Trail
- 620 Rosa Taylor Dr
- 613 Rosa Taylor Dr
- 880 Winchester Cir
- 770 Windsor Rd
- 518 High Point North Rd
- 621 Forest Hill Rd
- 2945 Crestline Dr
- 803 Captain Kell Dr
- 4227 Wood Forest Place
- 161 Ten Knolls Dr
- 759 Mosby Ct
- 938 Lundy Terrace
- 627 Lokchapee Ridge
- 636 Lokchapee Ridge
- 649 Woodridge Dr
- 665 Woodridge Dr
- 673 Woodridge Dr
- 641 Woodridge Dr
- 806 Willow Creek Dr
- 639 Woodridge Dr
- 650 Woodridge Dr
- 681 Woodridge Dr
- 658 Woodridge Dr
- 820 Willow Creek Dr
- 810 Willow Creek Dr Unit 810
- 802 Willow Creek Dr
- 808 Willow Creek Dr
- 822 Willow Creek Dr
- 642 Woodridge Dr
- 800 Willow Creek Dr
- 2996 Crestline Dr
- 662 Woodridge Dr
- 824 Willow Creek Dr
- 828 Willow Creek Dr