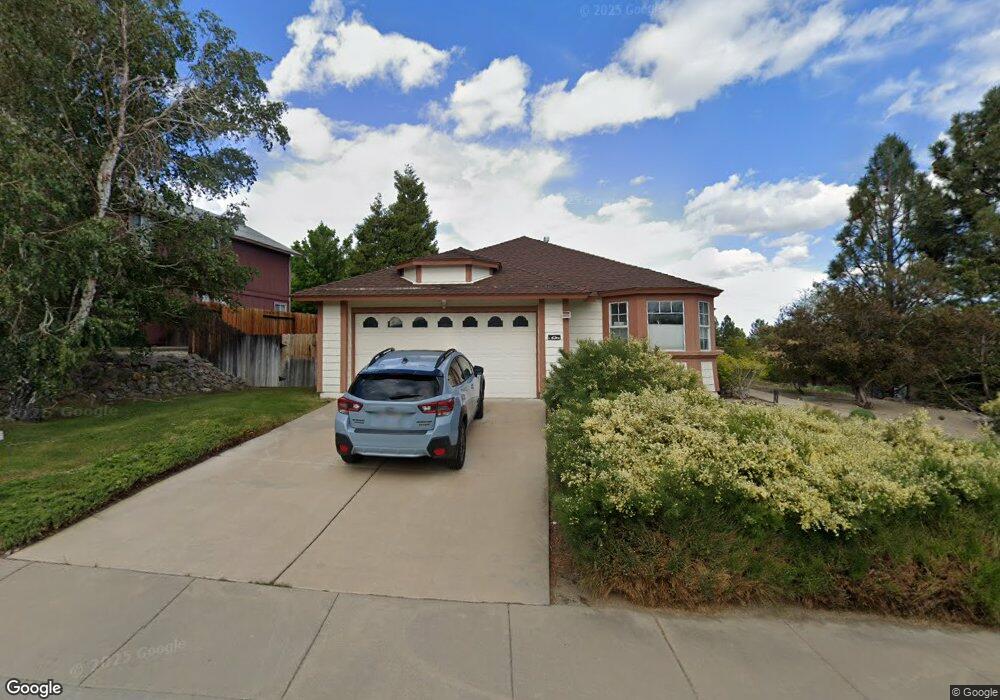
6571 Fall River Cir Reno, NV 89523
Mae Anne Avenue NeighborhoodEstimated Value: $533,000 - $563,000
3
Beds
2
Baths
1,530
Sq Ft
$356/Sq Ft
Est. Value
About This Home
This home is located at 6571 Fall River Cir, Reno, NV 89523 and is currently estimated at $545,345, approximately $356 per square foot. 6571 Fall River Cir is a home located in Washoe County with nearby schools including B D Billinghurst Middle School, Robert McQueen High School, and Riverview Christian Academy.
Ownership History
Date
Name
Owned For
Owner Type
Purchase Details
Closed on
Mar 24, 2016
Sold by
Steppat Clare E
Bought by
Steppat Clare E and The Clare E Steppat Living Trust
Current Estimated Value
Purchase Details
Closed on
May 17, 2005
Sold by
Livi Steppat Clare E
Bought by
Steppat Clare E
Purchase Details
Closed on
Jul 25, 2003
Sold by
Steppat Fritz C
Bought by
Steppat Fritz C and The Fritz C Steppat Revocable Living Tr
Home Financials for this Owner
Home Financials are based on the most recent Mortgage that was taken out on this home.
Original Mortgage
$92,000
Outstanding Balance
$38,058
Interest Rate
5.13%
Mortgage Type
Unknown
Estimated Equity
$507,287
Purchase Details
Closed on
May 2, 2003
Sold by
Steppat Fritz C
Bought by
Fritz C Steppat Revocable Living Trust
Purchase Details
Closed on
Feb 4, 1997
Sold by
Mcgah Dutton and Mcgah Bailey
Bought by
Steppat Fritz C
Home Financials for this Owner
Home Financials are based on the most recent Mortgage that was taken out on this home.
Original Mortgage
$122,000
Interest Rate
7.62%
Mortgage Type
Balloon
Create a Home Valuation Report for This Property
The Home Valuation Report is an in-depth analysis detailing your home's value as well as a comparison with similar homes in the area
Home Values in the Area
Average Home Value in this Area
Purchase History
| Date | Buyer | Sale Price | Title Company |
|---|---|---|---|
| Steppat Clare E | -- | None Available | |
| Steppat Clare E | -- | -- | |
| Steppat Fritz C | -- | Western Title Incorporated | |
| Steppat Fritz C | -- | Western Title Incorporated | |
| Steppat Fritz C | -- | Western Title Incorporated | |
| Steppat Fritz C | -- | Western Title Incorporated | |
| Fritz C Steppat Revocable Living Trust | -- | -- | |
| Steppat Fritz C | $158,500 | Stewart Title |
Source: Public Records
Mortgage History
| Date | Status | Borrower | Loan Amount |
|---|---|---|---|
| Open | Steppat Fritz C | $92,000 | |
| Closed | Steppat Fritz C | $122,000 |
Source: Public Records
Tax History
| Year | Tax Paid | Tax Assessment Tax Assessment Total Assessment is a certain percentage of the fair market value that is determined by local assessors to be the total taxable value of land and additions on the property. | Land | Improvement |
|---|---|---|---|---|
| 2026 | $1,897 | $95,235 | $39,340 | $55,895 |
| 2024 | $2,392 | $93,268 | $35,595 | $57,673 |
| 2023 | $2,392 | $92,256 | $37,520 | $54,736 |
| 2022 | $2,323 | $77,302 | $31,605 | $45,697 |
| 2021 | $2,256 | $67,327 | $21,735 | $45,592 |
| 2020 | $2,191 | $66,699 | $20,895 | $45,804 |
| 2019 | $2,127 | $65,127 | $20,755 | $44,372 |
| 2018 | $2,060 | $58,589 | $15,085 | $43,504 |
| 2017 | $2,482 | $58,428 | $14,774 | $43,654 |
| 2016 | $1,953 | $58,020 | $13,304 | $44,716 |
| 2015 | $2,299 | $56,177 | $11,650 | $44,527 |
| 2014 | $2,462 | $53,454 | $10,474 | $42,980 |
| 2013 | -- | $50,028 | $7,607 | $42,421 |
Source: Public Records
Map
Nearby Homes
- 6566 Chesterfield Ln
- 6850 Sharlands Ave Unit 1165
- 6850 Sharlands Ave Unit U2123
- 6850 Sharlands Ave Unit f2026
- 6850 Sharlands Ave Unit L2066
- 6331 Chesterfield Ln
- 1285 Moon Ridge Cir
- 395 Jackson Springs Dr
- 325 Jackson Springs Dr
- 6290 Chesterfield Ln
- 1585 Mescalero Ave
- 0 Unit 250003854
- 6052 Bankside Way
- 265 Anselmo Dr
- 8101 Leroy St
- 5875 Walnut Creek Rd
- 5846 Walnut Creek Rd
- 7440 W 4th St
- 7440 W 4th St Unit 7
- 7440 W 4th St Unit 73
- 6575 Fall River Cir
- 6565 Fall River Cir
- 6646 Chesterfield Ln
- 6658 Chesterfield Ln
- 6632 Chesterfield Ln
- 6574 Fall River Cir
- 6553 Fall River Cir
- 6580 Fall River Cir
- 6586 Fall River Cir
- 6628 Chesterfield Ln
- 6592 Fall River Cir
- 6547 Fall River Cir
- 6598 Fall River Cir
- 6568 Fall River Cir
- 6674 Chesterfield Ln
- 6614 Chesterfield Ln
- 6541 Fall River Cir
- 6562 Fall River Cir
- 6608 Chesterfield Ln
- 6535 Fall River Cir Unit 3N
Your Personal Tour Guide
Ask me questions while you tour the home.