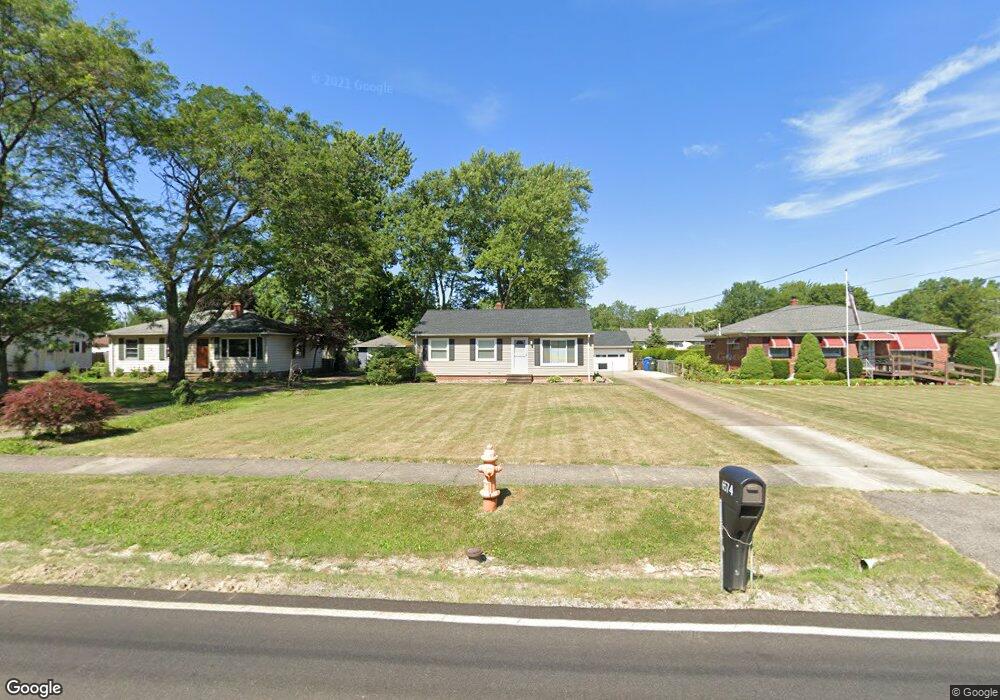
6574 Mackenzie Rd North Olmsted, OH 44070
Estimated Value: $214,155 - $268,000
3
Beds
1
Bath
1,064
Sq Ft
$227/Sq Ft
Est. Value
About This Home
This home is located at 6574 Mackenzie Rd, North Olmsted, OH 44070 and is currently estimated at $241,289, approximately $226 per square foot. 6574 Mackenzie Rd is a home located in Cuyahoga County with nearby schools including Chestnut Intermediate Elementary School, Pine Intermediate School, and North Olmsted Middle School.
Ownership History
Date
Name
Owned For
Owner Type
Purchase Details
Closed on
Aug 2, 2005
Sold by
Mazanec David J and Mazanec Traci Lyn
Bought by
Velez Victor M and Ortiz Maria E
Current Estimated Value
Home Financials for this Owner
Home Financials are based on the most recent Mortgage that was taken out on this home.
Original Mortgage
$134,883
Outstanding Balance
$70,856
Interest Rate
5.66%
Mortgage Type
FHA
Estimated Equity
$170,433
Purchase Details
Closed on
Jul 7, 1992
Sold by
Martens Joanne L
Bought by
Mazanec David J
Purchase Details
Closed on
Jan 25, 1991
Sold by
Martens Robert J
Bought by
Martens Joanne L
Purchase Details
Closed on
Jul 27, 1979
Sold by
Benedict John W and Benedict M
Bought by
Martens Robert J
Purchase Details
Closed on
Jan 1, 1975
Bought by
Benedict John W and Benedict M
Create a Home Valuation Report for This Property
The Home Valuation Report is an in-depth analysis detailing your home's value as well as a comparison with similar homes in the area
Home Values in the Area
Average Home Value in this Area
Purchase History
| Date | Buyer | Sale Price | Title Company |
|---|---|---|---|
| Velez Victor M | $137,000 | Barristers Title Agency | |
| Mazanec David J | $84,000 | -- | |
| Martens Joanne L | -- | -- | |
| Martens Robert J | $59,500 | -- | |
| Benedict John W | -- | -- |
Source: Public Records
Mortgage History
| Date | Status | Borrower | Loan Amount |
|---|---|---|---|
| Open | Velez Victor M | $134,883 |
Source: Public Records
Tax History Compared to Growth
Tax History
| Year | Tax Paid | Tax Assessment Tax Assessment Total Assessment is a certain percentage of the fair market value that is determined by local assessors to be the total taxable value of land and additions on the property. | Land | Improvement |
|---|---|---|---|---|
| 2024 | $4,008 | $58,485 | $11,970 | $46,515 |
| 2023 | $4,365 | $53,450 | $12,780 | $40,670 |
| 2022 | $4,342 | $53,450 | $12,780 | $40,670 |
| 2021 | $3,930 | $53,450 | $12,780 | $40,670 |
| 2020 | $3,792 | $45,680 | $10,920 | $34,760 |
| 2019 | $3,690 | $130,500 | $31,200 | $99,300 |
| 2018 | $3,674 | $45,680 | $10,920 | $34,760 |
| 2017 | $3,667 | $41,200 | $9,030 | $32,170 |
| 2016 | $3,635 | $41,200 | $9,030 | $32,170 |
| 2015 | $3,550 | $41,200 | $9,030 | $32,170 |
| 2014 | $3,550 | $40,010 | $8,750 | $31,260 |
Source: Public Records
Map
Nearby Homes
- 6560 Mackenzie Rd
- 6556 Louann Dr
- 6427 Mackenzie Rd
- 28130 Angela Dr
- 6706 Crestwood Ln
- 6752 Cypress Dr
- 6926 Mackenzie Rd
- 6096 Sherwood Dr
- 27097 Oakwood Cir Unit 208Z
- 0 Stearns Rd
- 7087 Mackenzie Rd
- 5943 Porter Rd
- 7097 Stearns Rd
- 6979 Warrington Dr
- 29408 Stewart Dr
- 29651 Westminster Dr
- VANDERBURGH Plan at Olmsted - Sanctuary of
- LYNDHURST Plan at Olmsted - Sanctuary of
- BELLEVILLE Plan at Olmsted - Sanctuary of
- ALDEN Plan at Olmsted - Sanctuary of
- 6588 Mackenzie Rd
- 6588 Mckenzie
- 6544 Mackenzie Rd
- 6602 Mackenzie Rd
- 6577 Maplehurst Rd
- 6561 Maplehurst Rd
- 6591 Maplehurst Rd
- 6605 Maplehurst Rd
- 6547 Maplehurst Rd
- 6618 Mackenzie Rd
- 6530 Mackenzie Rd
- 6583 Mackenzie Rd
- 6597 Mackenzie Rd
- 6567 Mackenzie Rd
- 28289 Westlawn Dr
- 6621 Maplehurst Rd
- 6611 Mackenzie Rd
- 6553 Mackenzie Rd
- 6632 Mackenzie Rd
- V/L Mackenzie Rd