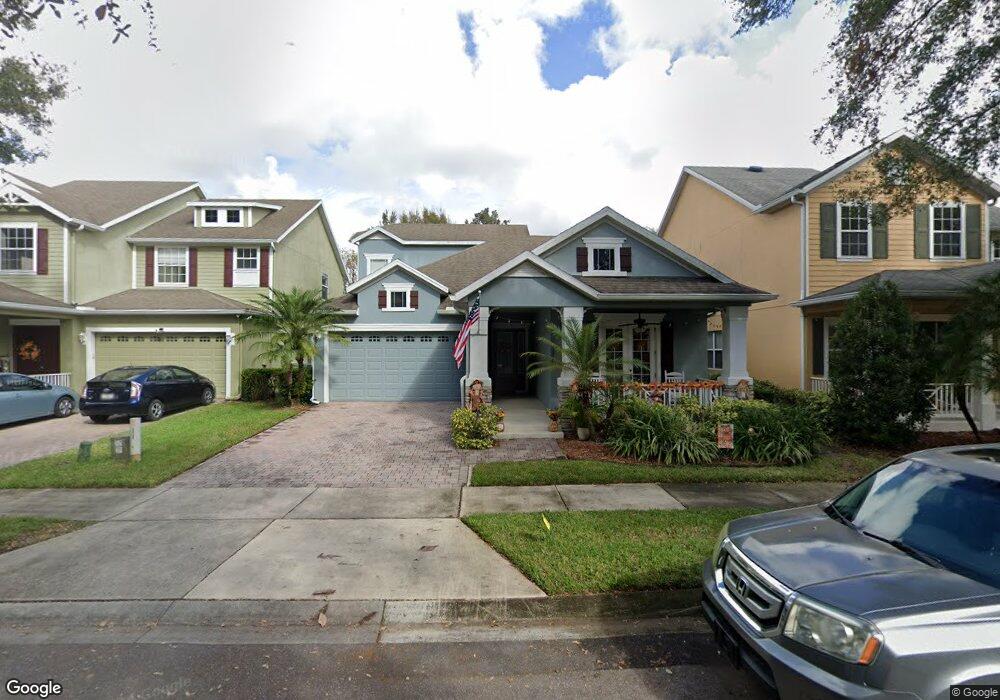
6579 Helmsley Cir Windermere, FL 34786
Estimated Value: $578,425 - $811,000
4
Beds
3
Baths
2,533
Sq Ft
$262/Sq Ft
Est. Value
About This Home
This home is located at 6579 Helmsley Cir, Windermere, FL 34786 and is currently estimated at $663,106, approximately $261 per square foot. 6579 Helmsley Cir is a home located in Orange County with nearby schools including Sunset Park Elementary School, Horizon West Middle School, and Windermere High School.
Ownership History
Date
Name
Owned For
Owner Type
Purchase Details
Closed on
Jul 29, 2013
Sold by
Markham Peter A and Shen Shawn Bo
Bought by
Markham Peter A and Shen Shawn Bo
Current Estimated Value
Purchase Details
Closed on
Jun 30, 2009
Sold by
Centerline Homes At Preston Square Llc
Bought by
Markham Peter A and Shen Shawn Bo
Purchase Details
Closed on
Apr 1, 2008
Sold by
Hh Preston Llc
Bought by
Centerline Homes At Preston Square Llc
Home Financials for this Owner
Home Financials are based on the most recent Mortgage that was taken out on this home.
Original Mortgage
$3,908,392
Interest Rate
5.97%
Mortgage Type
Purchase Money Mortgage
Purchase Details
Closed on
Mar 27, 2008
Sold by
Centerline Homes At Pretson Square Llc
Bought by
Hh Preston Llc
Home Financials for this Owner
Home Financials are based on the most recent Mortgage that was taken out on this home.
Original Mortgage
$3,908,392
Interest Rate
5.97%
Mortgage Type
Purchase Money Mortgage
Create a Home Valuation Report for This Property
The Home Valuation Report is an in-depth analysis detailing your home's value as well as a comparison with similar homes in the area
Home Values in the Area
Average Home Value in this Area
Purchase History
| Date | Buyer | Sale Price | Title Company |
|---|---|---|---|
| Markham Peter A | -- | Attorney | |
| Markham Peter A | $310,600 | Rtc Title Inc | |
| Centerline Homes At Preston Square Llc | $1,104,800 | Attorney | |
| Hh Preston Llc | $5,211,200 | Attorney |
Source: Public Records
Mortgage History
| Date | Status | Borrower | Loan Amount |
|---|---|---|---|
| Previous Owner | Hh Preston Llc | $3,908,392 |
Source: Public Records
Tax History
| Year | Tax Paid | Tax Assessment Tax Assessment Total Assessment is a certain percentage of the fair market value that is determined by local assessors to be the total taxable value of land and additions on the property. | Land | Improvement |
|---|---|---|---|---|
| 2025 | $3,486 | $227,826 | -- | -- |
| 2024 | $3,049 | $221,405 | -- | -- |
| 2023 | $3,049 | $208,898 | $0 | $0 |
| 2022 | $2,985 | $202,814 | $0 | $0 |
| 2021 | $2,933 | $196,907 | $0 | $0 |
| 2020 | $2,794 | $194,188 | $0 | $0 |
| 2019 | $2,867 | $189,822 | $0 | $0 |
| 2018 | $2,842 | $186,283 | $0 | $0 |
| 2017 | $2,789 | $267,012 | $52,000 | $215,012 |
| 2016 | $2,758 | $260,422 | $52,000 | $208,422 |
| 2015 | $2,800 | $245,281 | $52,000 | $193,281 |
| 2014 | $2,850 | $227,615 | $42,000 | $185,615 |
Source: Public Records
Map
Nearby Homes
- 6615 Helmsley Cir
- 6573 Helmsley Cir
- 6552 Helmsley Cir
- 11401 Evesham Dr
- 6840 Helmsley Cir
- 6957 Northwich Dr
- 6846 Helmsley Cir
- 6871 Helmsley Cir
- 6799 Helmsley Cir
- 6752 Trellis Vine Loop
- 6965 Tettenhall Ln
- 7123 Calm Cove Ct
- 7231 Sangalla Dr
- 12235 Montalcino Cir
- 6712 Thornhill Cir
- 11545 Brickyard Pond Ln
- 11578 Ashlin Park Blvd
- 12132 Montalcino Cir
- 7271 Sunny Meadow Aly
- 11636 Water Run Aly
- 6585 Helmsley Cir
- 6591 Helmsley Cir
- 6567 Helmsley Cir
- 6561 Helmsley Cir
- 6597 Helmsley Cir
- 6578 Helmsley Cir
- 6584 Helmsley Cir
- 6572 Helmsley Cir
- 6564 Helmsley Cir
- 6590 Helmsley Cir
- 6603 Helmsley Cir
- 6555 Helmsley Cir
- 6596 Helmsley Cir
- 6609 Helmsley Cir
- 6549 Helmsley Cir
- 6548 Helmsley Cir
- 11357 Evesham Dr
- 11365 Evesham Dr
- 11353 Evesham Dr
- 6544 Helmsley Cir
Your Personal Tour Guide
Ask me questions while you tour the home.