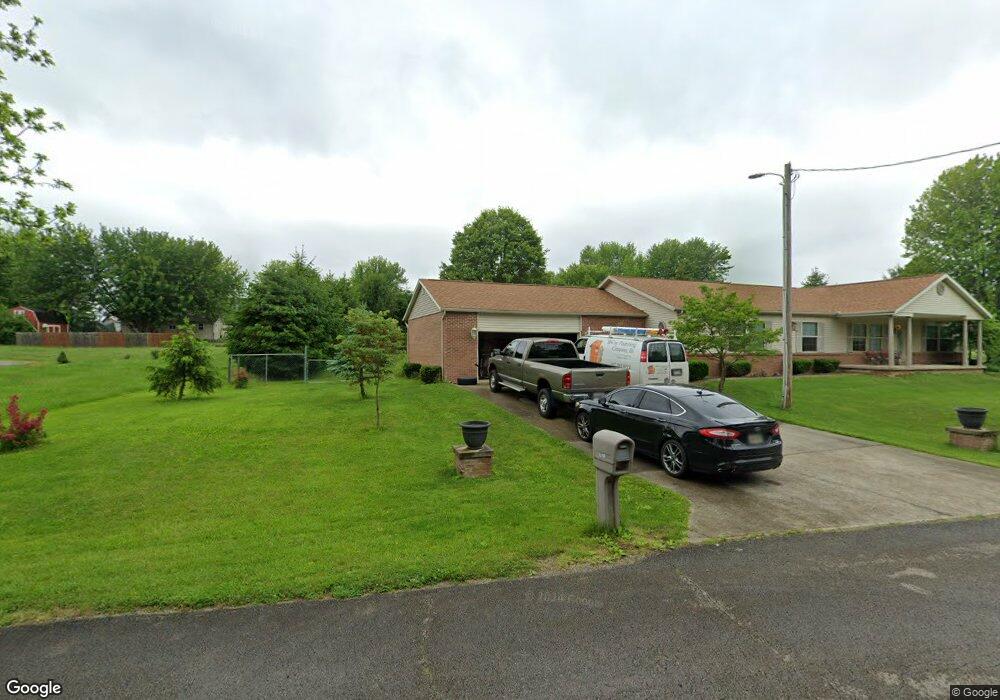
6579 Pied Piper Pkwy Hillsboro, OH 45133
Estimated Value: $197,000 - $306,000
3
Beds
2
Baths
2,100
Sq Ft
$123/Sq Ft
Est. Value
About This Home
This home is located at 6579 Pied Piper Pkwy, Hillsboro, OH 45133 and is currently estimated at $258,843, approximately $123 per square foot. 6579 Pied Piper Pkwy is a home with nearby schools including Hillsboro Primary School, Hillsboro Middle School, and Hillsboro High School.
Ownership History
Date
Name
Owned For
Owner Type
Purchase Details
Closed on
Aug 16, 2024
Sold by
Sampson Bobbie
Bought by
William R Van Meter Family Trust and Meter Van
Current Estimated Value
Purchase Details
Closed on
Aug 21, 2020
Sold by
Meter William Rodney Van
Bought by
Sampson Bobbie
Home Financials for this Owner
Home Financials are based on the most recent Mortgage that was taken out on this home.
Original Mortgage
$170,000
Interest Rate
3.1%
Mortgage Type
Future Advance Clause Open End Mortgage
Purchase Details
Closed on
Jul 1, 2020
Sold by
Snyder Bill G and Snyder Patricia L
Bought by
Vanmeter William Rodney and Sampson Bobbie
Home Financials for this Owner
Home Financials are based on the most recent Mortgage that was taken out on this home.
Original Mortgage
$170,000
Interest Rate
3.1%
Mortgage Type
Future Advance Clause Open End Mortgage
Purchase Details
Closed on
Jan 1, 1990
Bought by
Lederer Janet
Create a Home Valuation Report for This Property
The Home Valuation Report is an in-depth analysis detailing your home's value as well as a comparison with similar homes in the area
Home Values in the Area
Average Home Value in this Area
Purchase History
| Date | Buyer | Sale Price | Title Company |
|---|---|---|---|
| William R Van Meter Family Trust | -- | None Listed On Document | |
| Sampson Bobbie | -- | None Available | |
| Vanmeter William Rodney | $170,000 | None Available | |
| Lederer Janet | -- | -- |
Source: Public Records
Mortgage History
| Date | Status | Borrower | Loan Amount |
|---|---|---|---|
| Previous Owner | Vanmeter William Rodney | $170,000 |
Source: Public Records
Tax History Compared to Growth
Tax History
| Year | Tax Paid | Tax Assessment Tax Assessment Total Assessment is a certain percentage of the fair market value that is determined by local assessors to be the total taxable value of land and additions on the property. | Land | Improvement |
|---|---|---|---|---|
| 2024 | $2,292 | $66,010 | $3,570 | $62,440 |
| 2023 | $2,292 | $46,350 | $2,910 | $43,440 |
| 2022 | $1,778 | $46,350 | $2,910 | $43,440 |
| 2021 | $2,205 | $46,350 | $2,910 | $43,440 |
| 2020 | $1,231 | $42,110 | $2,630 | $39,480 |
| 2019 | $1,216 | $42,110 | $2,630 | $39,480 |
| 2018 | $1,090 | $42,110 | $2,630 | $39,480 |
| 2017 | $812 | $27,200 | $2,450 | $24,750 |
| 2016 | $813 | $27,200 | $2,450 | $24,750 |
| 2015 | $840 | $27,200 | $2,450 | $24,750 |
| 2014 | $877 | $27,200 | $2,450 | $24,750 |
| 2013 | $860 | $27,200 | $2,450 | $24,750 |
Source: Public Records
Map
Nearby Homes
- 6565 Fascination Way
- 6549 Wizard of Oz Way
- 6503 Spring Hill Dr
- 6607 Fascination Way
- 6609 Fascination Way
- 6613 Wizard of Oz Way
- 6628 Park Ln
- 6553 Wizard of Oz Way
- 6555 Wizard of Oz Way
- 6532 Beechwood Ln
- 57+-AC N Shore Dr
- 6611 Beechwood Rd
- 0 N Shore Rd Unit 1845070
- 5804 Fishermans Wharf Rd
- 1.013ac Fisherman Wharf Rd
- 6949 Highland Trail W Unit TLW
- acres +- N Beach Rd
- 5679 Fishermans Wharf Rd
- 11515 Dundee Dr
- 7069 Forest Cove Cir
- 6585 Pied Piper Pkwy
- 6575 Pied Piper Pkwy
- 6576 Pied Piper Pkwy
- 6549 Fascination Way
- 6591 Pied Piper Pkwy
- 6591 Pied Piper Pkwy
- 6551 Fascination Way
- 6584 Pied Piper Pkwy
- 6547 Fascination Way
- 6553 Fascination Way
- 6590 Pied Piper Pkwy
- 6590 Pied Piper Pkwy
- 6566 Spring Hill Dr
- 6555 Fascination Way
- 6564 Spring Hill Dr
- 6543 Fascination Way
- 6557 Fascination Way
- 6595 Pied Piper Pkwy
- 6595 Pied Piper Pkwy
- 6562 Spring Hill Dr