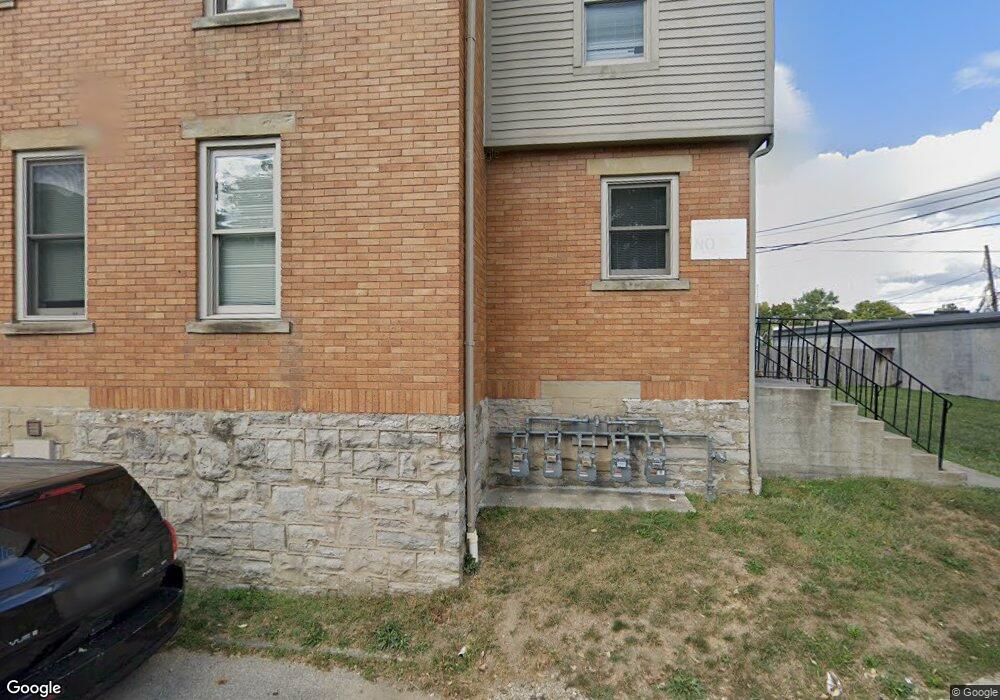
658-660 Kimball Place Columbus, OH 43205
Driving Park NeighborhoodEstimated Value: $278,653 - $385,000
6
Beds
2
Baths
2,180
Sq Ft
$142/Sq Ft
Est. Value
About This Home
This home is located at 658-660 Kimball Place, Columbus, OH 43205 and is currently estimated at $309,163, approximately $141 per square foot. 658-660 Kimball Place is a home located in Franklin County with nearby schools including Fairwood Alternative Elementary School, South High School, and Capital Collegiate Preparatory Academy.
Ownership History
Date
Name
Owned For
Owner Type
Purchase Details
Closed on
Apr 4, 2024
Sold by
Nagi Harmanpreet
Bought by
Amadi Chizindu M
Current Estimated Value
Home Financials for this Owner
Home Financials are based on the most recent Mortgage that was taken out on this home.
Original Mortgage
$346,500
Outstanding Balance
$341,184
Interest Rate
6.74%
Mortgage Type
New Conventional
Estimated Equity
-$32,021
Purchase Details
Closed on
Apr 2, 2020
Sold by
Sheau Lang Properties Llc
Bought by
Nagi Harmanreet
Purchase Details
Closed on
Mar 20, 2018
Sold by
Ambrose Jeremy
Bought by
Shea Lang Properties Llc
Purchase Details
Closed on
Dec 22, 2016
Sold by
Sharples Maureen
Bought by
Ambrose Jeremy
Home Financials for this Owner
Home Financials are based on the most recent Mortgage that was taken out on this home.
Original Mortgage
$43,460
Interest Rate
4.08%
Mortgage Type
Purchase Money Mortgage
Purchase Details
Closed on
Apr 13, 2007
Sold by
Klosterman Laura S and Klosterman Kenneth A
Bought by
Sharples Maureen
Create a Home Valuation Report for This Property
The Home Valuation Report is an in-depth analysis detailing your home's value as well as a comparison with similar homes in the area
Home Values in the Area
Average Home Value in this Area
Purchase History
| Date | Buyer | Sale Price | Title Company |
|---|---|---|---|
| Amadi Chizindu M | $385,000 | Ohio Real Title | |
| Nagi Harmanreet | $110,000 | Pm Title Llc | |
| Shea Lang Properties Llc | $119,000 | Associates Title Inc | |
| Ambrose Jeremy | $41,500 | Associates Title Inc | |
| Sharples Maureen | $56,000 | Foundation |
Source: Public Records
Mortgage History
| Date | Status | Borrower | Loan Amount |
|---|---|---|---|
| Open | Amadi Chizindu M | $346,500 | |
| Previous Owner | Ambrose Jeremy | $43,460 |
Source: Public Records
Tax History Compared to Growth
Tax History
| Year | Tax Paid | Tax Assessment Tax Assessment Total Assessment is a certain percentage of the fair market value that is determined by local assessors to be the total taxable value of land and additions on the property. | Land | Improvement |
|---|---|---|---|---|
| 2024 | $2,226 | $82,460 | $8,750 | $73,710 |
| 2023 | $2,199 | $82,460 | $8,750 | $73,710 |
| 2022 | $2,213 | $44,000 | $1,820 | $42,180 |
| 2021 | $2,331 | $41,650 | $1,820 | $39,830 |
| 2020 | $2,221 | $41,650 | $1,820 | $39,830 |
| 2019 | $2,865 | $41,650 | $1,820 | $39,830 |
| 2018 | $1,073 | $16,800 | $1,820 | $14,980 |
| 2017 | $1,045 | $16,800 | $1,820 | $14,980 |
| 2016 | $1,241 | $15,400 | $2,870 | $12,530 |
| 2015 | $1,103 | $15,400 | $2,870 | $12,530 |
| 2014 | $955 | $15,400 | $2,870 | $12,530 |
| 2013 | $648 | $18,130 | $3,395 | $14,735 |
Source: Public Records
Map
Nearby Homes
- 1339 Mooberry St
- 1328 Kent St
- 568-570 Kimball Place
- 0 Mooberry St
- 572 Linwood Ave
- 0 E Fulton St
- 693 Kelton Ave
- 1342 E Fulton St
- 1364 E Fulton St Unit 366
- 734 Linwood Ave
- 532 Linwood Ave Unit 34
- 668 Wilson Ave
- 1468 E Fulton St
- 764-766 Kelton Ave
- 1390 E Livingston Ave
- 1345 E Livingston Ave Unit 1347
- 693 Wilson Ave
- 0 Lilley Ave
- 1186-1188 E Livingston Ave Unit 1186
- 829-831 Studer Ave
- 658 Kimball Place Unit 660
- 658 Kimball Place Unit 60
- 660 Kimball Place
- 1320 Kent St
- 1319 Mooberry St
- 655 Kimball Place
- 1291 Mooberry St
- 671 Kimball Place Unit 673
- 671-673 Kimball Place
- 1287 Mooberry St
- 1289 Kent St
- 1335 Mooberry St
- 677 Kimball Place
- 1279 Mooberry St
- 1279 Mooberry St Unit 81
- 1277 Mooberry St
- 1277 Mooberry St Unit 279
- 1322-1324 Kent St
- 1322 Kent St Unit 324
- 1322 Kent St Unit 1324