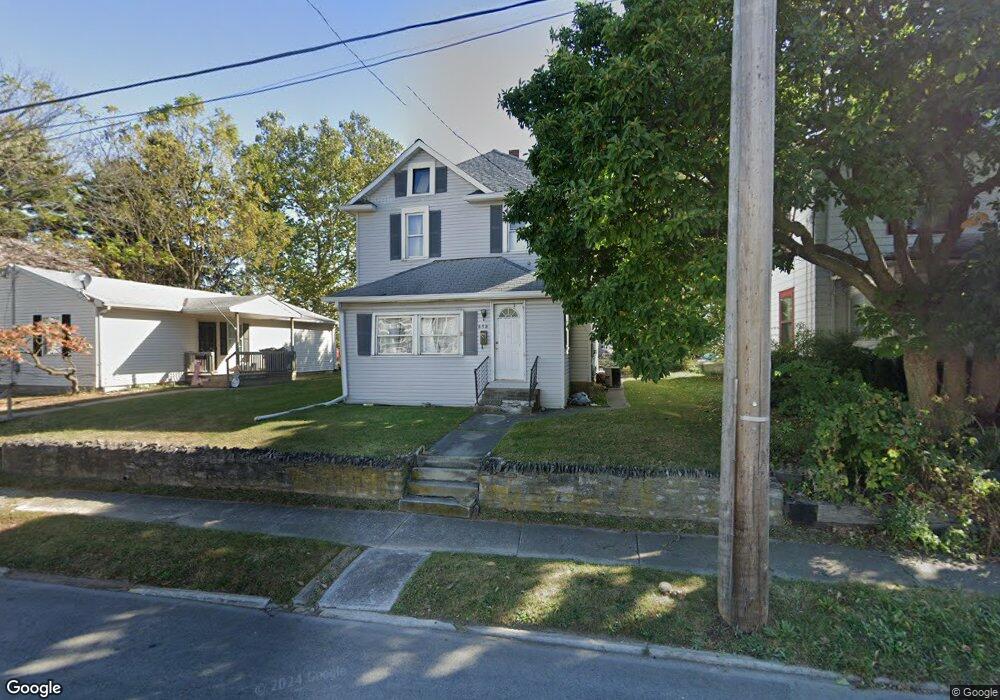
658 Davids St Marion, OH 43302
Estimated Value: $93,000 - $144,384
3
Beds
2
Baths
1,344
Sq Ft
$93/Sq Ft
Est. Value
About This Home
This home is located at 658 Davids St, Marion, OH 43302 and is currently estimated at $125,596, approximately $93 per square foot. 658 Davids St is a home located in Marion County with nearby schools including William McKinley Elementary School, Ulysses S. Grant Middle School, and Harding High School.
Ownership History
Date
Name
Owned For
Owner Type
Purchase Details
Closed on
Aug 19, 2011
Sold by
The Secretary Of Hud
Bought by
Hall Carola D
Current Estimated Value
Home Financials for this Owner
Home Financials are based on the most recent Mortgage that was taken out on this home.
Original Mortgage
$31,744
Outstanding Balance
$21,591
Interest Rate
4.5%
Mortgage Type
FHA
Estimated Equity
$104,005
Purchase Details
Closed on
Jul 29, 2010
Sold by
Cruz Susanna
Bought by
Us Bank Na
Purchase Details
Closed on
May 18, 2010
Sold by
Us Bank Na
Bought by
Secretary Of Hud
Purchase Details
Closed on
May 3, 2006
Sold by
Smith Sondra K
Bought by
Cruz Susanna
Home Financials for this Owner
Home Financials are based on the most recent Mortgage that was taken out on this home.
Original Mortgage
$67,467
Interest Rate
6.37%
Mortgage Type
FHA
Create a Home Valuation Report for This Property
The Home Valuation Report is an in-depth analysis detailing your home's value as well as a comparison with similar homes in the area
Home Values in the Area
Average Home Value in this Area
Purchase History
| Date | Buyer | Sale Price | Title Company |
|---|---|---|---|
| Hall Carola D | -- | Chicago Title | |
| Us Bank Na | $33,334 | None Available | |
| Secretary Of Hud | -- | None Available | |
| Cruz Susanna | $68,000 | Chicago Title |
Source: Public Records
Mortgage History
| Date | Status | Borrower | Loan Amount |
|---|---|---|---|
| Open | Hall Carola D | $31,744 | |
| Previous Owner | Cruz Susanna | $67,467 |
Source: Public Records
Tax History
| Year | Tax Paid | Tax Assessment Tax Assessment Total Assessment is a certain percentage of the fair market value that is determined by local assessors to be the total taxable value of land and additions on the property. | Land | Improvement |
|---|---|---|---|---|
| 2025 | $1,133 | $39,130 | $3,870 | $35,260 |
| 2024 | $1,133 | $29,530 | $3,790 | $25,740 |
| 2023 | $1,133 | $29,530 | $3,790 | $25,740 |
| 2022 | $1,052 | $29,530 | $3,790 | $25,740 |
| 2021 | $914 | $23,090 | $3,290 | $19,800 |
| 2020 | $916 | $23,090 | $3,290 | $19,800 |
| 2019 | $891 | $23,090 | $3,290 | $19,800 |
| 2018 | $705 | $18,280 | $3,260 | $15,020 |
| 2017 | $714 | $18,280 | $3,260 | $15,020 |
| 2016 | $710 | $18,280 | $3,260 | $15,020 |
| 2015 | $709 | $17,870 | $3,100 | $14,770 |
| 2014 | $654 | $16,430 | $3,100 | $13,330 |
| 2012 | $475 | $11,880 | $2,490 | $9,390 |
Source: Public Records
Map
Nearby Homes
- 681 Davids St
- 645 Henry St
- 602 Uncapher Ave
- 579 Henry St
- 638 Miami St
- 793 Congress St
- 491 Olney Ave
- 545 Blaine Ave
- 863 Congress St
- 780 Sheridan Rd
- 889 Oak Grove Ave
- 447 Olney Ave
- 426 Bellefontaine Ave
- 376 Park Blvd
- 340 Marion Ave
- 329 Mound St
- 950 Oak Grove Ave
- 981 Davids St
- 447 Windsor St
- 982 Oak Grove Ave
Your Personal Tour Guide
Ask me questions while you tour the home.