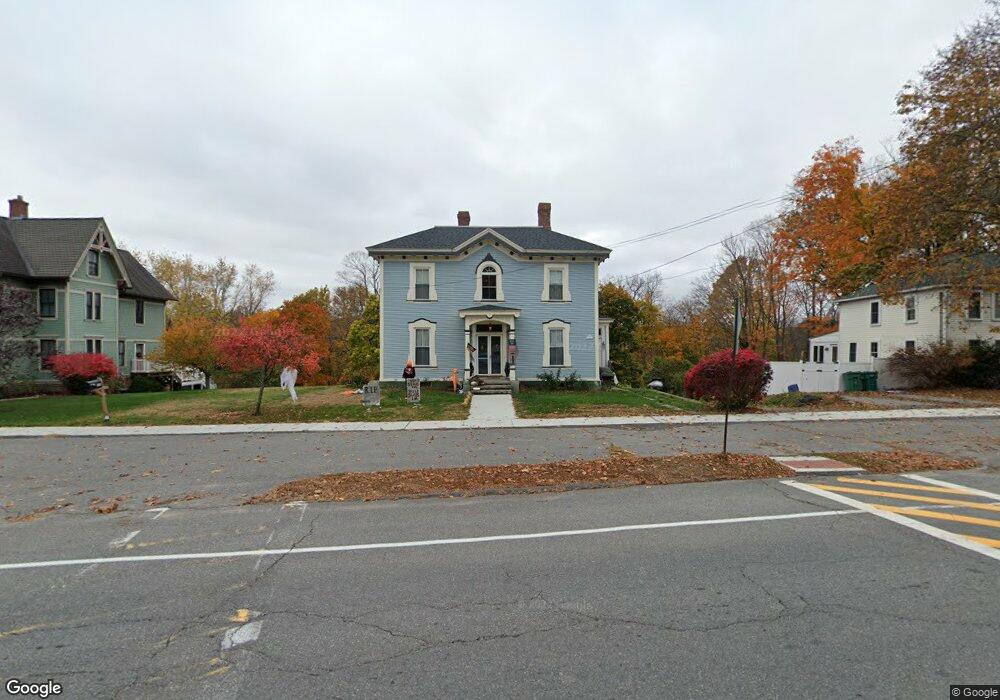
658 Main St Lancaster, MA 01523
Estimated Value: $549,000 - $680,000
2
Beds
3
Baths
2,814
Sq Ft
$222/Sq Ft
Est. Value
About This Home
This home is located at 658 Main St, Lancaster, MA 01523 and is currently estimated at $623,717, approximately $221 per square foot. 658 Main St is a home located in Worcester County with nearby schools including Mary Rowlandson Elementary School, Luther Burbank Middle School, and Nashoba Regional High School.
Ownership History
Date
Name
Owned For
Owner Type
Purchase Details
Closed on
Apr 29, 2025
Sold by
Knop Mark M and Knop Pamela A
Bought by
Knop Mark M
Current Estimated Value
Home Financials for this Owner
Home Financials are based on the most recent Mortgage that was taken out on this home.
Original Mortgage
$119,815
Outstanding Balance
$119,391
Interest Rate
6.65%
Mortgage Type
Second Mortgage Made To Cover Down Payment
Estimated Equity
$504,326
Purchase Details
Closed on
Dec 15, 2005
Sold by
Queen Jessica K Est and Eusey
Bought by
Knop Mark M and Knop Pamela A
Home Financials for this Owner
Home Financials are based on the most recent Mortgage that was taken out on this home.
Original Mortgage
$268,369
Interest Rate
6.34%
Mortgage Type
Purchase Money Mortgage
Create a Home Valuation Report for This Property
The Home Valuation Report is an in-depth analysis detailing your home's value as well as a comparison with similar homes in the area
Home Values in the Area
Average Home Value in this Area
Purchase History
| Date | Buyer | Sale Price | Title Company |
|---|---|---|---|
| Knop Mark M | $75,000 | None Available | |
| Knop Mark M | $75,000 | None Available | |
| Knop Mark M | $253,100 | -- | |
| Knop Mark M | $253,100 | -- |
Source: Public Records
Mortgage History
| Date | Status | Borrower | Loan Amount |
|---|---|---|---|
| Open | Knop Mark M | $119,815 | |
| Closed | Knop Mark M | $119,815 | |
| Previous Owner | Knop Mark M | $247,450 | |
| Previous Owner | Knop Mark M | $268,369 |
Source: Public Records
Tax History Compared to Growth
Tax History
| Year | Tax Paid | Tax Assessment Tax Assessment Total Assessment is a certain percentage of the fair market value that is determined by local assessors to be the total taxable value of land and additions on the property. | Land | Improvement |
|---|---|---|---|---|
| 2025 | $8,865 | $548,600 | $108,700 | $439,900 |
| 2024 | $9,779 | $560,100 | $101,200 | $458,900 |
| 2023 | $8,665 | $504,100 | $92,000 | $412,100 |
| 2022 | $8,791 | $452,000 | $95,200 | $356,800 |
| 2021 | $6,753 | $338,000 | $95,200 | $242,800 |
| 2020 | $6,419 | $323,400 | $95,200 | $228,200 |
| 2019 | $6,134 | $310,600 | $95,200 | $215,400 |
| 2018 | $5,908 | $295,700 | $95,200 | $200,500 |
| 2016 | $5,497 | $281,200 | $94,400 | $186,800 |
| 2015 | $5,210 | $277,700 | $94,400 | $183,300 |
| 2014 | $5,193 | $274,600 | $94,400 | $180,200 |
Source: Public Records
Map
Nearby Homes
- 553 Neck Rd
- 132 Kilbourn Rd
- 453 Blue Heron Dr Unit 453
- 85 Prescott St
- 51 Kilbourn Rd
- 29 Bennett Ln
- 0 Main St
- 92 Mill St
- 136 Narrow Ln
- 18 Burbank Ln
- 121 Sylvan Rd
- 51 Still River Rd
- 164 Sterling Rd
- 12 Woodruff Rd
- 8 John F. Kennedy Ave
- 1105 Ridgefield Cir Unit B
- 107 Ridgefield Cir Unit D
- 516 Ridgefield Cir Unit C
- 6 Worcester St
- 22 Kettle Hole Rd