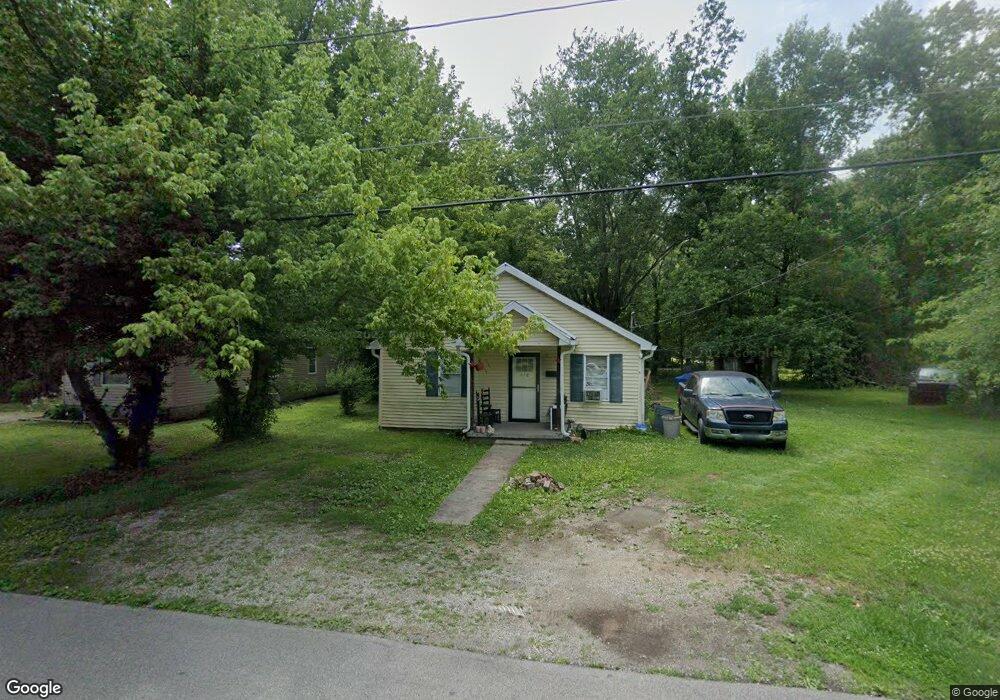
658 Mann Ave Austin, IN 47102
Estimated Value: $90,000 - $136,000
1
Bed
1
Bath
806
Sq Ft
$135/Sq Ft
Est. Value
About This Home
This home is located at 658 Mann Ave, Austin, IN 47102 and is currently estimated at $108,542, approximately $134 per square foot. 658 Mann Ave is a home located in Scott County with nearby schools including Austin Elementary School, Austin Middle School, and Austin High School.
Ownership History
Date
Name
Owned For
Owner Type
Purchase Details
Closed on
Feb 26, 2014
Sold by
State Of Indiana
Bought by
Tex and Cora
Current Estimated Value
Purchase Details
Closed on
Feb 21, 2014
Sold by
Homes Investing Llc
Bought by
Murphy Tex E and Murphy Cora
Purchase Details
Closed on
Dec 9, 2009
Sold by
Scott County Property Management Llc
Bought by
Homes Investing Llc
Purchase Details
Closed on
Oct 6, 2006
Sold by
Everhart Marty
Bought by
Scott County Property Management Llc
Purchase Details
Closed on
Sep 11, 2006
Sold by
Homesales Inc
Bought by
Everhart Marty
Purchase Details
Closed on
Apr 11, 2006
Sold by
Mainous David
Bought by
Homesales Inc
Create a Home Valuation Report for This Property
The Home Valuation Report is an in-depth analysis detailing your home's value as well as a comparison with similar homes in the area
Home Values in the Area
Average Home Value in this Area
Purchase History
| Date | Buyer | Sale Price | Title Company |
|---|---|---|---|
| Tex | $2,962 | Scott County Government | |
| Murphy Tex E | $2,962 | None Available | |
| Homes Investing Llc | -- | None Available | |
| Scott County Property Management Llc | -- | None Available | |
| Everhart Marty | -- | None Available | |
| Homesales Inc | $23,000 | None Available |
Source: Public Records
Tax History
| Year | Tax Paid | Tax Assessment Tax Assessment Total Assessment is a certain percentage of the fair market value that is determined by local assessors to be the total taxable value of land and additions on the property. | Land | Improvement |
|---|---|---|---|---|
| 2025 | $485 | $21,400 | $6,500 | $14,900 |
| 2024 | $485 | $19,800 | $6,500 | $13,300 |
| 2023 | $532 | $20,100 | $6,500 | $13,600 |
| 2022 | $439 | $19,900 | $6,500 | $13,400 |
| 2021 | $389 | $18,800 | $6,500 | $12,300 |
| 2020 | $376 | $18,800 | $6,500 | $12,300 |
| 2019 | $376 | $18,800 | $6,500 | $12,300 |
| 2018 | $390 | $19,500 | $6,500 | $13,000 |
| 2017 | $392 | $19,600 | $6,500 | $13,100 |
| 2016 | $378 | $18,900 | $6,500 | $12,400 |
| 2014 | $534 | $26,700 | $7,600 | $19,100 |
| 2013 | $534 | $30,900 | $7,600 | $23,300 |
Source: Public Records
Map
Nearby Homes
Your Personal Tour Guide
Ask me questions while you tour the home.