658 N 750 E Orem, UT 84097
Orchard South NeighborhoodEstimated Value: $610,000 - $730,000
6
Beds
4
Baths
2,806
Sq Ft
$232/Sq Ft
Est. Value
About This Home
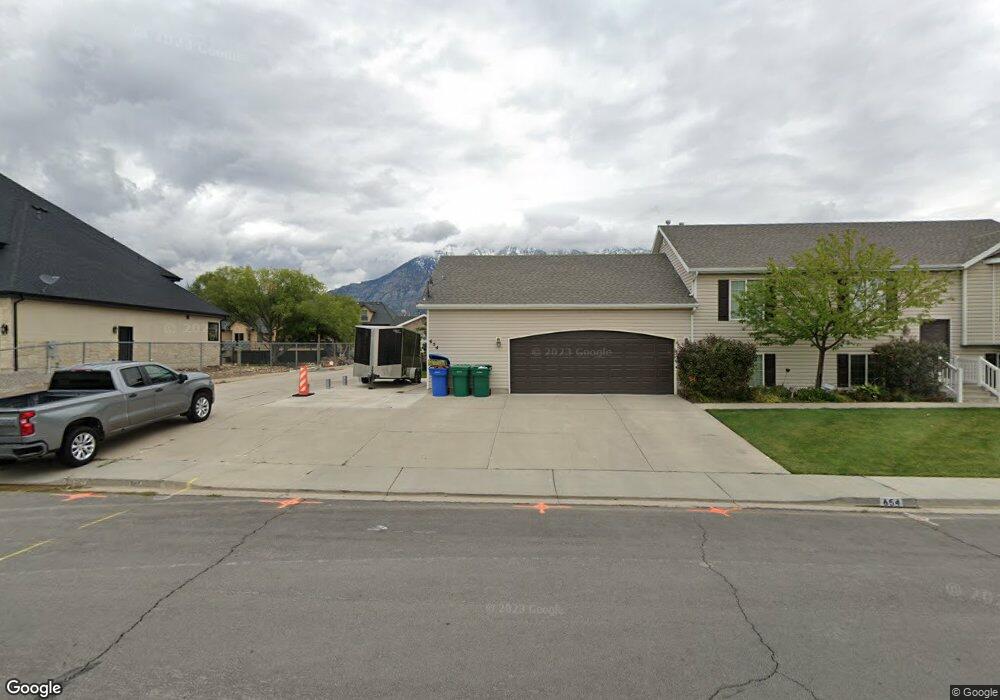
This home is located at 658 N 750 E, Orem, UT 84097 and is currently estimated at $650,259, approximately $231 per square foot. 658 N 750 E is a home located in Utah County with nearby schools including Foothill Elementary School, Canyon View Junior High School, and Orem High School.
Ownership History
Date
Name
Owned For
Owner Type
Purchase Details
Closed on
Oct 9, 2020
Sold by
Petersen James M
Bought by
Petersen Joseph Ryan
Current Estimated Value
Home Financials for this Owner
Home Financials are based on the most recent Mortgage that was taken out on this home.
Original Mortgage
$120,000
Outstanding Balance
$106,492
Interest Rate
2.9%
Mortgage Type
Credit Line Revolving
Estimated Equity
$543,767
Purchase Details
Closed on
Feb 16, 2012
Sold by
Us Bank National Association
Bought by
Smith Daniel S
Home Financials for this Owner
Home Financials are based on the most recent Mortgage that was taken out on this home.
Original Mortgage
$205,943
Interest Rate
3.75%
Mortgage Type
FHA
Purchase Details
Closed on
Oct 27, 2011
Sold by
Avila Artemio
Bought by
Us Bank National Association
Purchase Details
Closed on
Sep 26, 2002
Sold by
Budge Eric
Bought by
Avila Artemio
Home Financials for this Owner
Home Financials are based on the most recent Mortgage that was taken out on this home.
Original Mortgage
$176,000
Interest Rate
8.75%
Create a Home Valuation Report for This Property
The Home Valuation Report is an in-depth analysis detailing your home's value as well as a comparison with similar homes in the area
Home Values in the Area
Average Home Value in this Area
Purchase History
| Date | Buyer | Sale Price | Title Company |
|---|---|---|---|
| Petersen Joseph Ryan | -- | Access Title Co | |
| Smith Daniel S | -- | None Available | |
| Us Bank National Association | $180,000 | Inwest Title Services Salt | |
| Avila Artemio | -- | Guardian Title Insurance Ag |
Source: Public Records
Mortgage History
| Date | Status | Borrower | Loan Amount |
|---|---|---|---|
| Open | Petersen Joseph Ryan | $120,000 | |
| Previous Owner | Smith Daniel S | $205,943 | |
| Previous Owner | Avila Artemio | $176,000 |
Source: Public Records
Tax History
| Year | Tax Paid | Tax Assessment Tax Assessment Total Assessment is a certain percentage of the fair market value that is determined by local assessors to be the total taxable value of land and additions on the property. | Land | Improvement |
|---|---|---|---|---|
| 2025 | $2,396 | $319,440 | -- | -- |
| 2024 | $2,396 | $292,985 | $0 | $0 |
| 2023 | $2,245 | $295,075 | $0 | $0 |
| 2022 | $2,325 | $296,010 | $0 | $0 |
| 2021 | $2,184 | $421,200 | $150,500 | $270,700 |
| 2020 | $2,036 | $385,800 | $120,400 | $265,400 |
| 2019 | $1,775 | $349,900 | $112,900 | $237,000 |
| 2018 | $1,752 | $329,900 | $109,100 | $220,800 |
| 2017 | $1,692 | $170,665 | $0 | $0 |
| 2016 | $1,611 | $149,820 | $0 | $0 |
| 2015 | $1,505 | $132,385 | $0 | $0 |
| 2014 | $1,439 | $126,060 | $0 | $0 |
Source: Public Records
Map
Nearby Homes
Your Personal Tour Guide
Ask me questions while you tour the home.