Estimated Value: $271,000 - $385,417
3
Beds
1
Bath
1,322
Sq Ft
$232/Sq Ft
Est. Value
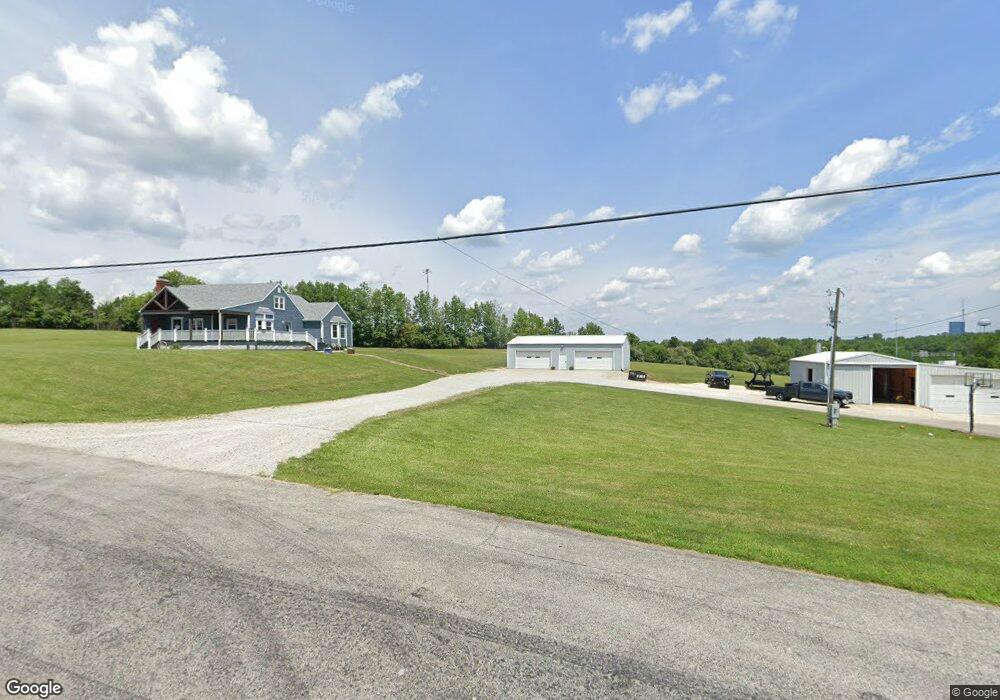
About This Home
This home is located at 658 Old Hook Rd, Xenia, OH 45385 and is currently estimated at $307,104, approximately $232 per square foot. 658 Old Hook Rd is a home located in Greene County with nearby schools including Xenia High School, Summit Academy Community School for Alternative Learners - Xenia, and Legacy Christian Academy.
Ownership History
Date
Name
Owned For
Owner Type
Purchase Details
Closed on
Jun 3, 2015
Sold by
Hagler Roland E and Hagler Joan A
Bought by
Brittingham Joshua D and Brittingham Crystal M
Current Estimated Value
Home Financials for this Owner
Home Financials are based on the most recent Mortgage that was taken out on this home.
Original Mortgage
$132,554
Outstanding Balance
$102,922
Interest Rate
3.82%
Mortgage Type
FHA
Estimated Equity
$204,182
Purchase Details
Closed on
Aug 3, 2004
Sold by
Hagler Roland E and Hagler Joan A
Bought by
Hagler Roland E and Hagler Joan A
Create a Home Valuation Report for This Property
The Home Valuation Report is an in-depth analysis detailing your home's value as well as a comparison with similar homes in the area
Purchase History
| Date | Buyer | Sale Price | Title Company |
|---|---|---|---|
| Brittingham Joshua D | $135,000 | Box Buckeye Title | |
| Brittingham Joshua D | -- | Attorney | |
| Hagler Roland E | -- | -- |
Source: Public Records
Mortgage History
| Date | Status | Borrower | Loan Amount |
|---|---|---|---|
| Open | Brittingham Joshua D | $132,554 |
Source: Public Records
Tax History
| Year | Tax Paid | Tax Assessment Tax Assessment Total Assessment is a certain percentage of the fair market value that is determined by local assessors to be the total taxable value of land and additions on the property. | Land | Improvement |
|---|---|---|---|---|
| 2024 | $5,090 | $106,010 | $26,520 | $79,490 |
| 2023 | $5,045 | $106,010 | $26,520 | $79,490 |
| 2022 | $4,480 | $85,350 | $23,060 | $62,290 |
| 2021 | $4,537 | $85,350 | $23,060 | $62,290 |
| 2020 | $4,356 | $85,350 | $23,060 | $62,290 |
| 2019 | $2,638 | $48,390 | $20,420 | $27,970 |
| 2018 | $2,645 | $48,390 | $20,420 | $27,970 |
| 2017 | $2,059 | $48,390 | $20,420 | $27,970 |
| 2016 | $2,060 | $36,980 | $19,890 | $17,090 |
| 2015 | $2,104 | $36,980 | $19,890 | $17,090 |
| 2014 | $2,020 | $36,980 | $19,890 | $17,090 |
Source: Public Records
Map
Nearby Homes
Your Personal Tour Guide
Ask me questions while you tour the home.