Estimated Value: $424,000 - $580,000
3
Beds
2
Baths
1,548
Sq Ft
$310/Sq Ft
Est. Value
About This Home
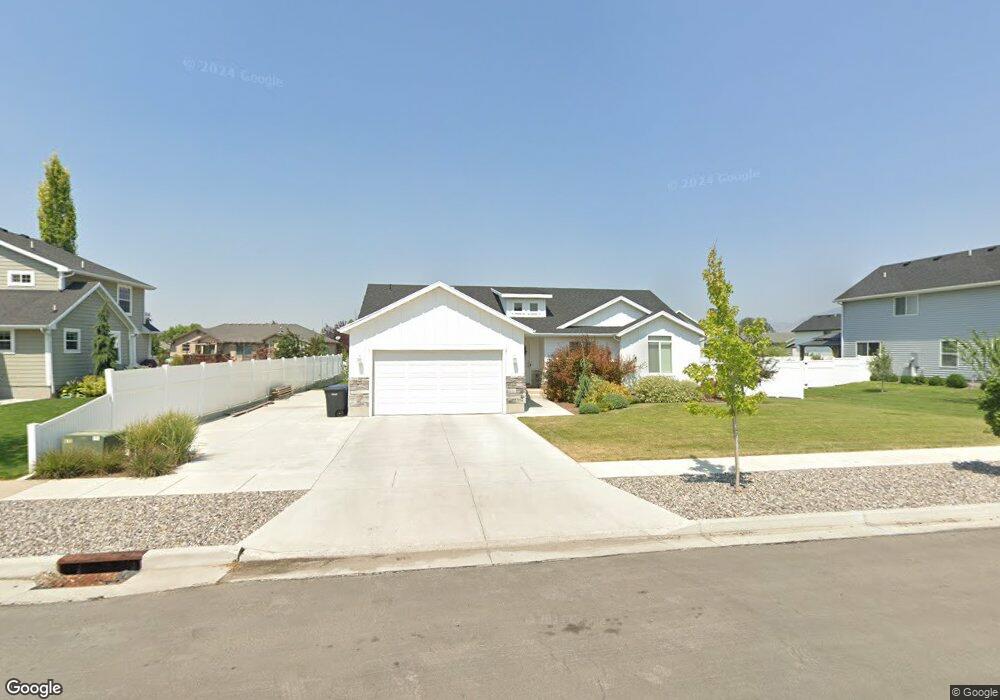
This home is located at 658 W 225 N Unit 226, Hyrum, UT 84319 and is currently estimated at $480,480, approximately $310 per square foot. 658 W 225 N Unit 226 is a home located in Cache County with nearby schools including Lincoln School, South Cache Middle School, and Mountain Crest High School.
Ownership History
Date
Name
Owned For
Owner Type
Purchase Details
Closed on
Feb 14, 2025
Sold by
Schaap Robert M and Hansen Alexandria
Bought by
Chavez Jorge Alejandro Be and Cardenas Elizabeth Gomez
Current Estimated Value
Home Financials for this Owner
Home Financials are based on the most recent Mortgage that was taken out on this home.
Original Mortgage
$407,550
Outstanding Balance
$404,546
Interest Rate
6.5%
Mortgage Type
New Conventional
Estimated Equity
$75,934
Purchase Details
Closed on
Jun 28, 2018
Sold by
Jeremy Higley Construction Inc
Bought by
Schaap Robert M and Hansen Alexandria
Home Financials for this Owner
Home Financials are based on the most recent Mortgage that was taken out on this home.
Original Mortgage
$259,522
Interest Rate
4.6%
Mortgage Type
New Conventional
Purchase Details
Closed on
Dec 15, 2017
Sold by
Chrs Development Group Llc
Bought by
Jeremy Highley Construction Inc
Create a Home Valuation Report for This Property
The Home Valuation Report is an in-depth analysis detailing your home's value as well as a comparison with similar homes in the area
Home Values in the Area
Average Home Value in this Area
Purchase History
| Date | Buyer | Sale Price | Title Company |
|---|---|---|---|
| Chavez Jorge Alejandro Be | -- | Advanced Title | |
| Schaap Robert M | -- | Hickman Land Title Company | |
| Jeremy Highley Construction Inc | -- | -- |
Source: Public Records
Mortgage History
| Date | Status | Borrower | Loan Amount |
|---|---|---|---|
| Open | Chavez Jorge Alejandro Be | $407,550 | |
| Previous Owner | Schaap Robert M | $259,522 |
Source: Public Records
Tax History Compared to Growth
Tax History
| Year | Tax Paid | Tax Assessment Tax Assessment Total Assessment is a certain percentage of the fair market value that is determined by local assessors to be the total taxable value of land and additions on the property. | Land | Improvement |
|---|---|---|---|---|
| 2025 | $1,583 | $227,315 | $0 | $0 |
| 2024 | $1,528 | $204,815 | $0 | $0 |
| 2023 | $1,734 | $222,365 | $0 | $0 |
| 2022 | $1,810 | $222,365 | $0 | $0 |
| 2021 | $1,659 | $314,045 | $74,500 | $239,545 |
| 2020 | $1,592 | $282,800 | $74,500 | $208,300 |
| 2019 | $1,624 | $271,300 | $63,000 | $208,300 |
| 2018 | $833 | $74,000 | $74,000 | $0 |
Source: Public Records
Map
Nearby Homes