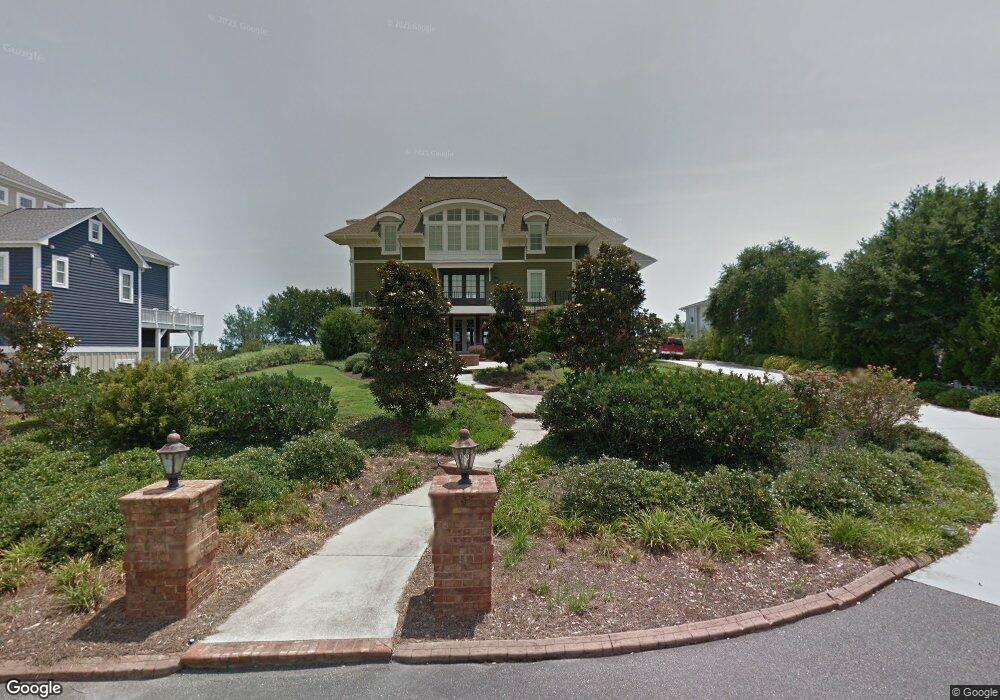
6580 Towles Rd Wilmington, NC 28409
Greenville Loop NeighborhoodEstimated Value: $2,683,000 - $4,964,000
5
Beds
6
Baths
5,427
Sq Ft
$713/Sq Ft
Est. Value
About This Home
This home is located at 6580 Towles Rd, Wilmington, NC 28409 and is currently estimated at $3,866,744, approximately $712 per square foot. 6580 Towles Rd is a home located in New Hanover County with nearby schools including Bradley Creek Elementary School, Roland-Grise Middle School, and John T. Hoggard High School.
Ownership History
Date
Name
Owned For
Owner Type
Purchase Details
Closed on
Jan 13, 2003
Sold by
Ledbetter Russell H
Bought by
Marushack Michael Mary Frederi
Current Estimated Value
Purchase Details
Closed on
Apr 30, 2002
Sold by
Ledbetter Russell H
Bought by
Mckeithan G Christopher Mary L
Purchase Details
Closed on
Dec 10, 1997
Sold by
Garrett Cooke Enterprises Llc
Bought by
Ledbetter Russell H
Purchase Details
Closed on
Mar 27, 1996
Sold by
Powell Hershell Ryland
Bought by
Garrett Cooke Enterprises Llc
Purchase Details
Closed on
Jan 4, 1995
Sold by
Powell Vivian Langley
Bought by
Powell Hershell Ryland
Purchase Details
Closed on
Aug 21, 1972
Sold by
Scott Herbert P Trustee Ann H
Bought by
Powell Hershell Byland Vivian
Purchase Details
Closed on
Dec 31, 1963
Sold by
Towles E B Sarah P
Bought by
Greenville Sound Land Co
Create a Home Valuation Report for This Property
The Home Valuation Report is an in-depth analysis detailing your home's value as well as a comparison with similar homes in the area
Home Values in the Area
Average Home Value in this Area
Purchase History
| Date | Buyer | Sale Price | Title Company |
|---|---|---|---|
| Marushack Michael Mary Frederi | $650,000 | -- | |
| Mckeithan G Christopher Mary L | -- | -- | |
| Ledbetter Russell H | $475,000 | -- | |
| Garrett Cooke Enterprises Llc | $450,000 | -- | |
| Powell Hershell Ryland | -- | -- | |
| Powell Hershell Byland Vivian | -- | -- | |
| Greenville Sound Land Co | -- | -- |
Source: Public Records
Tax History Compared to Growth
Tax History
| Year | Tax Paid | Tax Assessment Tax Assessment Total Assessment is a certain percentage of the fair market value that is determined by local assessors to be the total taxable value of land and additions on the property. | Land | Improvement |
|---|---|---|---|---|
| 2025 | $21,462 | $3,801,800 | $1,667,500 | $2,134,300 |
| 2024 | $21,462 | $2,466,900 | $1,754,800 | $712,100 |
| 2023 | $20,845 | $2,466,900 | $1,754,800 | $712,100 |
| 2022 | $20,969 | $2,466,900 | $1,754,800 | $712,100 |
| 2021 | $21,112 | $2,466,900 | $1,754,800 | $712,100 |
| 2020 | $19,217 | $1,824,300 | $864,000 | $960,300 |
| 2019 | $19,217 | $1,824,300 | $864,000 | $960,300 |
| 2018 | $217 | $1,824,300 | $864,000 | $960,300 |
| 2017 | $19,217 | $1,824,300 | $864,000 | $960,300 |
| 2016 | $16,168 | $1,459,200 | $720,000 | $739,200 |
| 2015 | $15,453 | $1,459,200 | $720,000 | $739,200 |
| 2014 | $14,796 | $1,459,200 | $720,000 | $739,200 |
Source: Public Records
Map
Nearby Homes
- 6433 Shinn Creek Ln
- 6265 Turtle Hall Dr
- 825 Inlet View Dr
- 824 Inlet View Dr
- 6412 Westport Dr
- 3201 Rensler Ct
- 6404 Westport Dr
- 6321 Guinea Ln
- 6212 Turtle Hall Dr
- 6300 Sea Mist Ct
- 4539 Auriana Way
- 4420 Finch Ln
- 6138 Bailey Buck Rd
- 306 Water St
- 217 Water St
- 1807 Bungalow Row
- 821 Schloss St
- 4006 Tamarisk Ln
- 760 S Lumina Ave
- 910 S Lumina Ave
- 6600 Towles Rd
- 6582 Towles Rd
- 6800 Towles Rd
- 6804 Towles Rd
- 6572 Towles Rd
- 6415 Hawks Bill Dr
- 6568 Towles Rd
- 6807 Towles Rd
- 6808 Towles Rd
- 6419 Hawks Bill Dr
- 6809 Towles Rd
- 6810 Towles Rd
- 6423 Hawks Bill Dr
- 6811 Towles Rd
- 6815 Towles Rd
- 6819 Towles Rd
- 6823 Towles Rd
- 6427 Hawks Bill Dr
- 6827 Towles Rd
- 6424 Hawks Bill Dr