6582 E Iris Dr Syracuse, IN 46567
Estimated Value: $336,000 - $616,000
3
Beds
4
Baths
2,496
Sq Ft
$174/Sq Ft
Est. Value
About This Home
This home is located at 6582 E Iris Dr, Syracuse, IN 46567 and is currently estimated at $434,525, approximately $174 per square foot. 6582 E Iris Dr is a home located in Kosciusko County with nearby schools including Wawasee High School and PEACEFUL WOODS.
Ownership History
Date
Name
Owned For
Owner Type
Purchase Details
Closed on
Dec 7, 2020
Sold by
Charlton Steven C and Charlton Shelia E
Bought by
Charlton Steven C and Charlton Shelia E
Current Estimated Value
Home Financials for this Owner
Home Financials are based on the most recent Mortgage that was taken out on this home.
Original Mortgage
$172,358
Outstanding Balance
$151,968
Interest Rate
2.8%
Mortgage Type
FHA
Estimated Equity
$282,557
Purchase Details
Closed on
Dec 7, 2007
Sold by
Nottingham Kristina
Bought by
Charlton Steve C and Charlton Shelia E
Home Financials for this Owner
Home Financials are based on the most recent Mortgage that was taken out on this home.
Original Mortgage
$103,120
Interest Rate
6.31%
Mortgage Type
New Conventional
Create a Home Valuation Report for This Property
The Home Valuation Report is an in-depth analysis detailing your home's value as well as a comparison with similar homes in the area
Purchase History
| Date | Buyer | Sale Price | Title Company |
|---|---|---|---|
| Charlton Steven C | -- | None Available | |
| Charlton Steve C | -- | None Available |
Source: Public Records
Mortgage History
| Date | Status | Borrower | Loan Amount |
|---|---|---|---|
| Open | Charlton Steven C | $172,358 | |
| Closed | Charlton Steve C | $103,120 |
Source: Public Records
Tax History
| Year | Tax Paid | Tax Assessment Tax Assessment Total Assessment is a certain percentage of the fair market value that is determined by local assessors to be the total taxable value of land and additions on the property. | Land | Improvement |
|---|---|---|---|---|
| 2025 | $1,155 | $335,200 | $74,000 | $261,200 |
| 2024 | $1,155 | $277,500 | $46,200 | $231,300 |
| 2023 | $1,085 | $255,600 | $41,200 | $214,400 |
| 2022 | $1,067 | $237,700 | $41,200 | $196,500 |
| 2021 | $877 | $206,300 | $41,200 | $165,100 |
| 2020 | $742 | $194,900 | $35,400 | $159,500 |
| 2019 | $774 | $185,400 | $33,000 | $152,400 |
| 2018 | $702 | $179,400 | $33,000 | $146,400 |
| 2017 | $562 | $153,300 | $33,000 | $120,300 |
| 2016 | $498 | $154,700 | $33,000 | $121,700 |
| 2014 | $540 | $154,100 | $33,000 | $121,100 |
| 2013 | $540 | $155,400 | $33,000 | $122,400 |
Source: Public Records
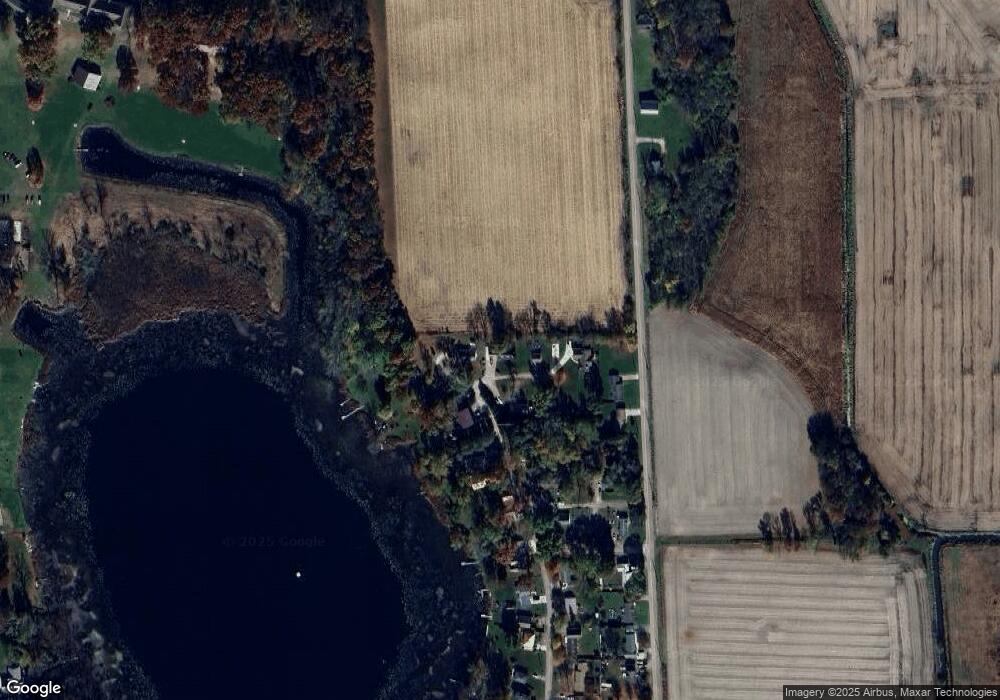
Map
Nearby Homes
- 13495 N Hillside Dr
- 13471 N Eastshore Dr
- 1147 E Northshore Dr
- 1135 E Northshore Dr
- 19575 S County Line Rd
- 12601 N Pleasant Grove Rd
- 13826 N 560 E
- 500 E Medusa St
- 12840 N 775 E
- 102 N Front St Unit 3
- 700 S Lakeside Dr Unit 6
- 124 N Front St
- 300 E Medusa St Unit 5D
- 209 N Lake St
- 301 N Lake St
- 14284 U S 6
- 7790 E Cherokee Rd
- 211 W Boston St
- 605 N Huntington St
- 12240 N Mariposa Cir
- 6635 E Iris Dr
- 13572 N Hillside Dr
- 6630 E Iris Dr
- 13597 N Hillside Dr
- 13607 N Hillside Dr
- 13565 N Hillside Dr
- 13575 N Hillside Dr
- 13593 N Warner Rd
- 13587 N Hillside Dr Unit Bonar Lakefront
- 13587 N Hillside Dr
- 13551 N Hillside Dr
- 13571 N Warner Rd Unit Bonar Lake
- 13571 N Warner Rd
- 13529 N Hillside Dr
- 13521 N Hillside Dr
- 6658 E Hochstetler Rd
- 13512 N Hillside Dr
- 6640 E Beck Ave
- 13486 N Hillside Dr
- 13716 N Warner Rd
Your Personal Tour Guide
Ask me questions while you tour the home.