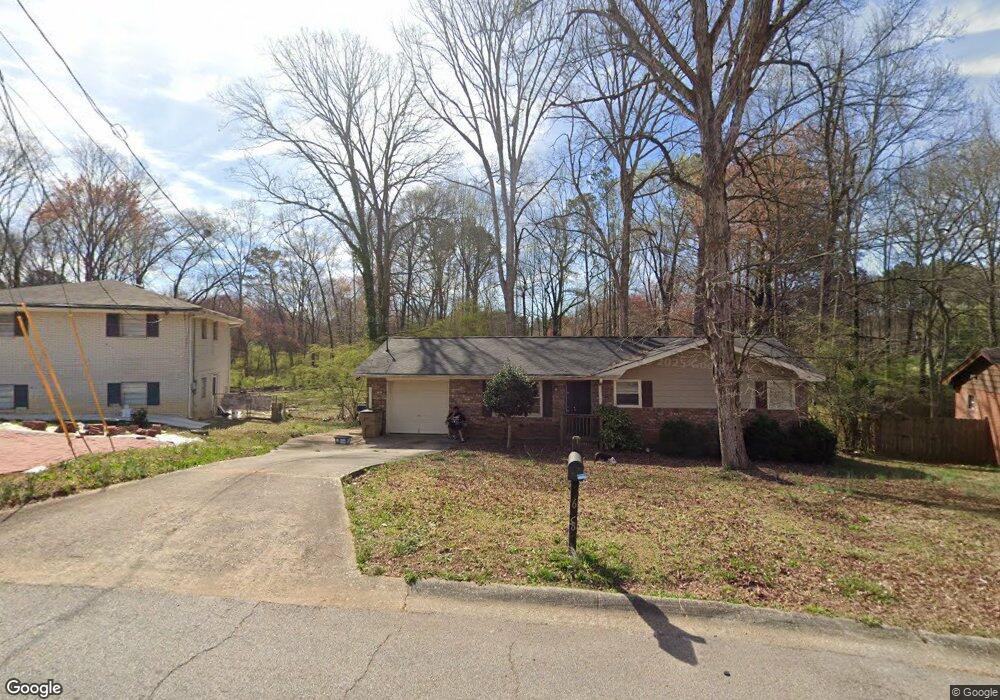
6582 Rabun Rd Morrow, GA 30260
Estimated Value: $143,000 - $209,000
3
Beds
2
Baths
1,175
Sq Ft
$155/Sq Ft
Est. Value
About This Home
This home is located at 6582 Rabun Rd, Morrow, GA 30260 and is currently estimated at $181,653, approximately $154 per square foot. 6582 Rabun Rd is a home located in Clayton County with nearby schools including William M. Mcgarrah Elementary School, Morrow Middle School, and Morrow High School.
Ownership History
Date
Name
Owned For
Owner Type
Purchase Details
Closed on
Aug 3, 2022
Sold by
Valor Homes 500 Llc
Bought by
Valor Holding Llc
Current Estimated Value
Purchase Details
Closed on
Apr 3, 2008
Sold by
Real Estate Solution Providers
Bought by
Alaimo Anthony
Purchase Details
Closed on
Aug 6, 2007
Sold by
St Martin Peter
Bought by
Real Estate Solutions Provider
Home Financials for this Owner
Home Financials are based on the most recent Mortgage that was taken out on this home.
Original Mortgage
$78,000
Interest Rate
6.27%
Mortgage Type
Trade
Purchase Details
Closed on
Dec 18, 2006
Sold by
Nice Homes Llc
Bought by
St Martin Peter
Home Financials for this Owner
Home Financials are based on the most recent Mortgage that was taken out on this home.
Original Mortgage
$78,000
Interest Rate
6.31%
Mortgage Type
Trade
Create a Home Valuation Report for This Property
The Home Valuation Report is an in-depth analysis detailing your home's value as well as a comparison with similar homes in the area
Home Values in the Area
Average Home Value in this Area
Purchase History
| Date | Buyer | Sale Price | Title Company |
|---|---|---|---|
| Valor Holding Llc | -- | -- | |
| Alaimo Anthony | -- | -- | |
| Real Estate Solutions Provider | -- | -- | |
| St Martin Peter | $83,500 | -- | |
| Nice Homes Llc | $75,000 | -- |
Source: Public Records
Mortgage History
| Date | Status | Borrower | Loan Amount |
|---|---|---|---|
| Previous Owner | Real Estate Solutions Provider | $78,000 | |
| Previous Owner | Nice Homes Llc | $78,000 |
Source: Public Records
Tax History Compared to Growth
Tax History
| Year | Tax Paid | Tax Assessment Tax Assessment Total Assessment is a certain percentage of the fair market value that is determined by local assessors to be the total taxable value of land and additions on the property. | Land | Improvement |
|---|---|---|---|---|
| 2024 | $1,888 | $48,400 | $8,000 | $40,400 |
| 2023 | $1,748 | $48,400 | $8,000 | $40,400 |
| 2022 | $1,900 | $48,400 | $8,000 | $40,400 |
| 2021 | $1,137 | $28,800 | $6,400 | $22,400 |
| 2020 | $1,152 | $28,800 | $6,400 | $22,400 |
| 2019 | $1,169 | $29,560 | $6,400 | $23,160 |
| 2018 | $844 | $20,800 | $6,400 | $14,400 |
| 2017 | $846 | $20,800 | $6,400 | $14,400 |
| 2016 | $846 | $23,106 | $6,400 | $16,706 |
| 2015 | $480 | $0 | $0 | $0 |
| 2014 | $477 | $12,000 | $6,400 | $5,600 |
Source: Public Records
Map
Nearby Homes
- 2617 Terrace Pkwy
- 6584 Sleepy Hollow Ln
- 2613 Stratford Ln Unit 3
- 6418 Maddox Rd
- 2577 Castile Dr
- 6605 Demere Dr Unit 3
- 6679 Cameron Rd
- 2217 Willoby Ct
- 2203 Willoby Ct Unit 2
- 6627 Cameron Rd
- 2455 Lake Harbin Rd
- 2756 Brook Dr
- 2688 Heritage Ln
- 2681 Heritage Ln
- 6495 Revena Dr
- 2609 Lake Harbin Rd
- 2705 Heritage Ln
- 2649 Lake Harbin Rd
- 6397 E Meyer Dr
- 2783 Mill Lake Way